
Methods organized around engineering decisions
18 integrated modules connect requirements and allocation, prediction, risk analysis, test planning, life and field evidence, maintainability, and statistical modeling. Each description below states what the method does; its adequacy still depends on the data, assumptions, diagnostics, and supported scope of the selected analysis.
90 analysis views show actual inputs, models, estimates and plots across the application. Every image opens at full resolution.
Method names are not blanket conformance claims. Perdura separates verified implementations, scoped approximations, screening models and unsupported regimes. Review the verification approach →
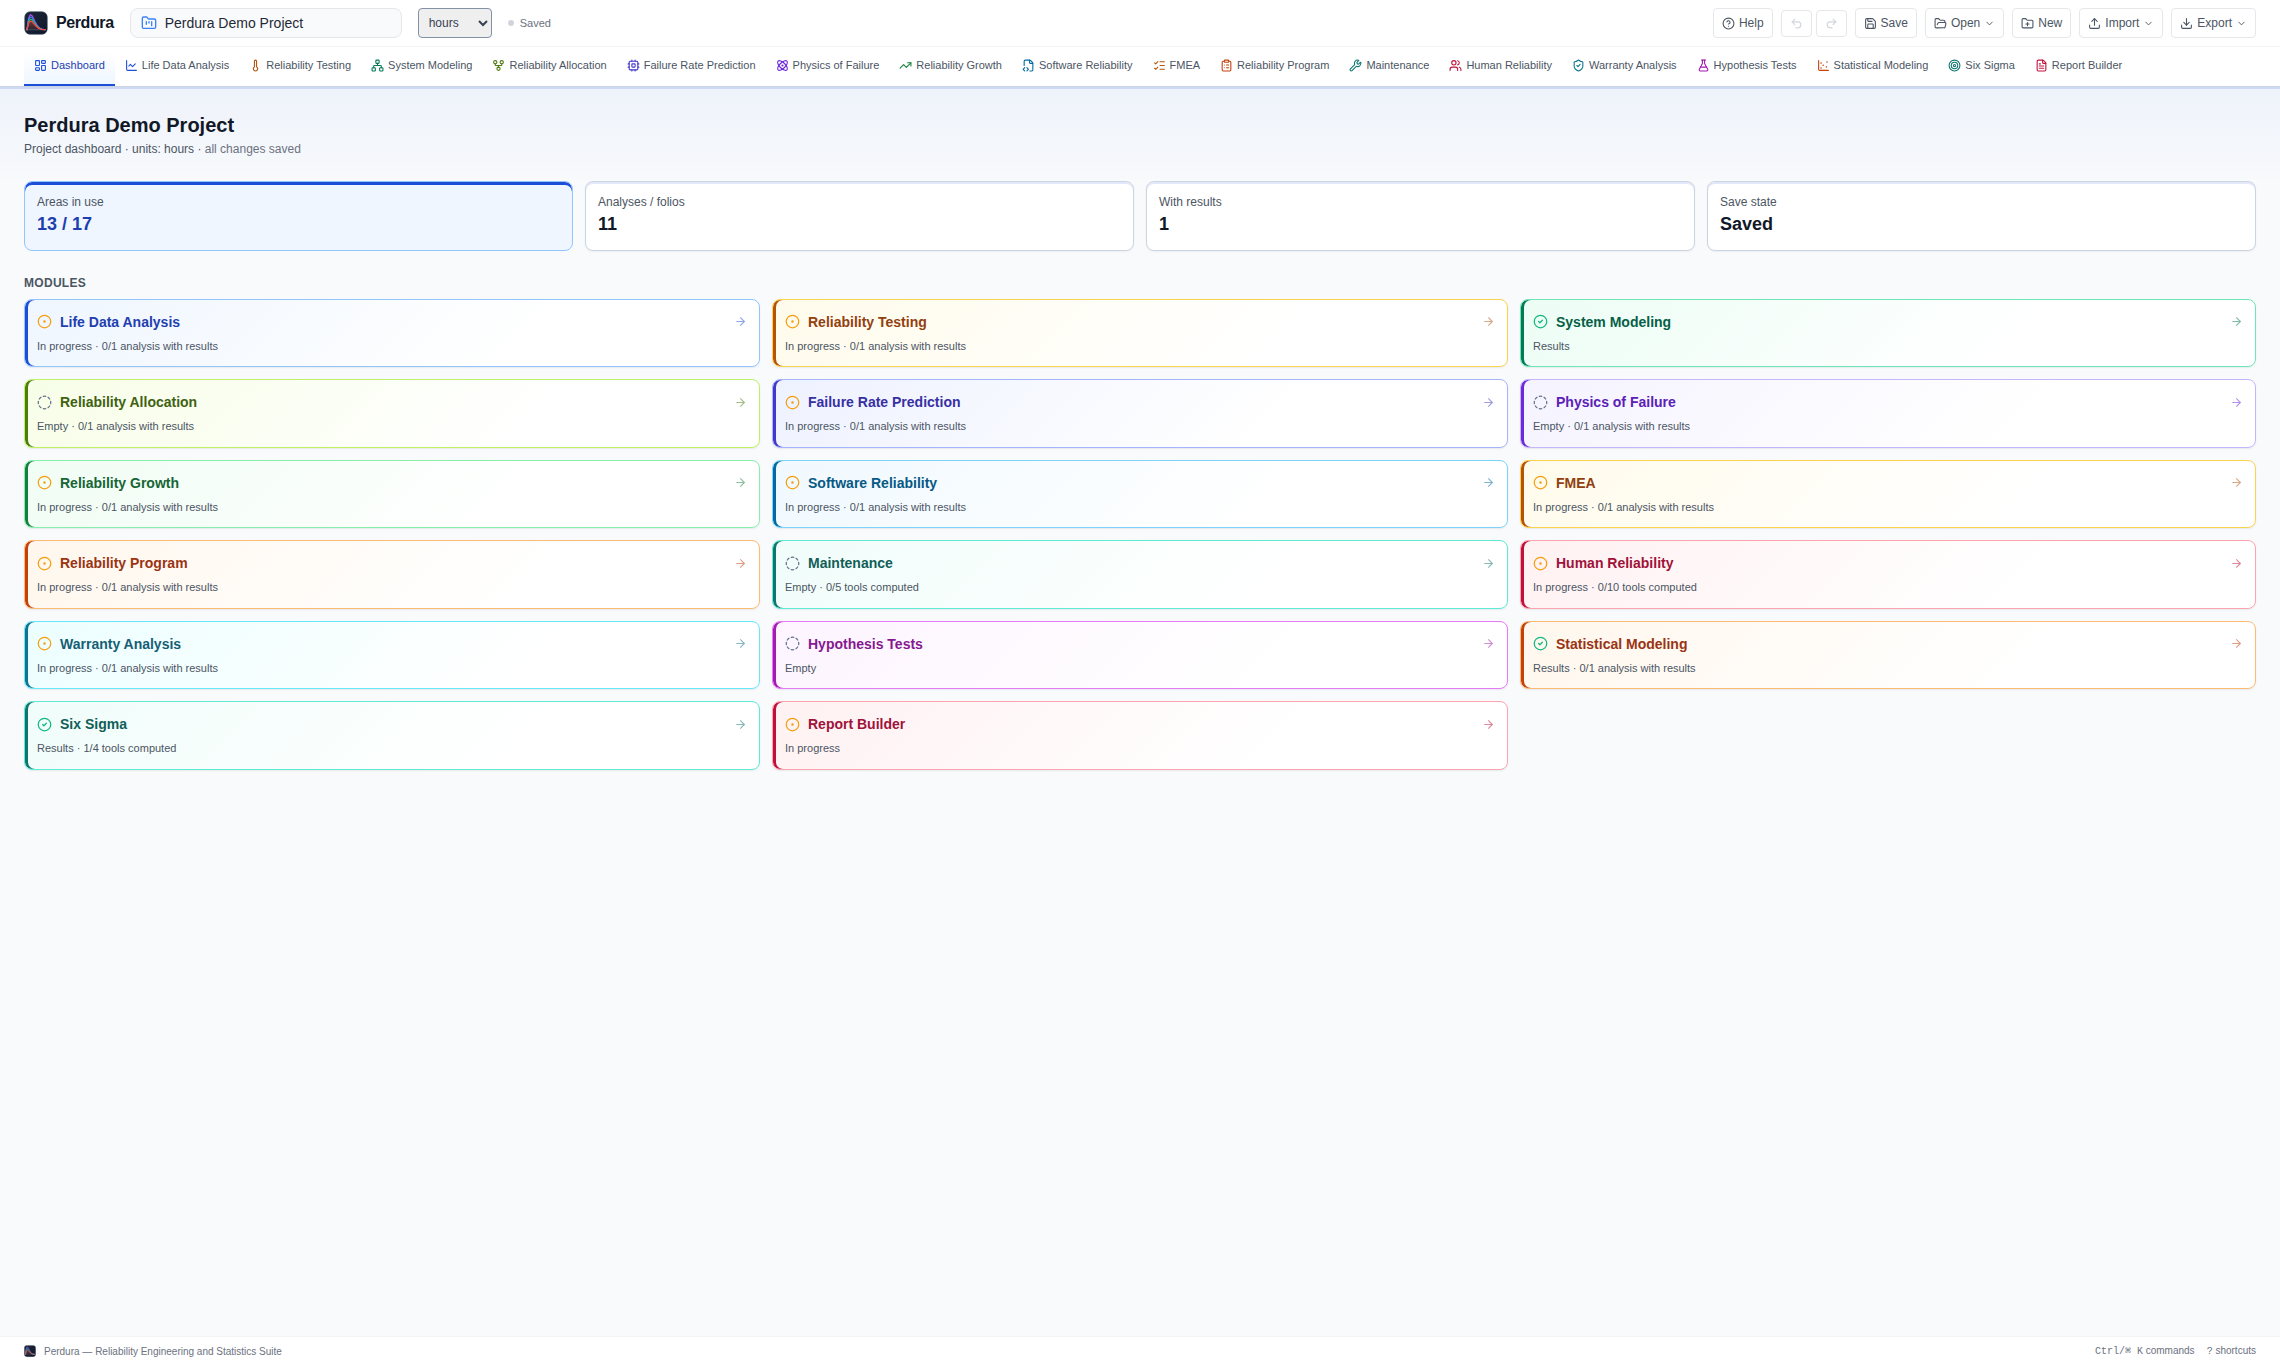
Project Dashboard
Review project status, analysis freshness and the next actions across the workspace.
- Project-wide module cards summarize configured, completed, stale and unsaved analysis state
- Freshness explanations identify the upstream change that invalidated a dependent result
- Recent projects and modified timestamps support fast, traceable return to active work
- Global units, save history and module navigation remain available from one workspace
Life Data Analysis
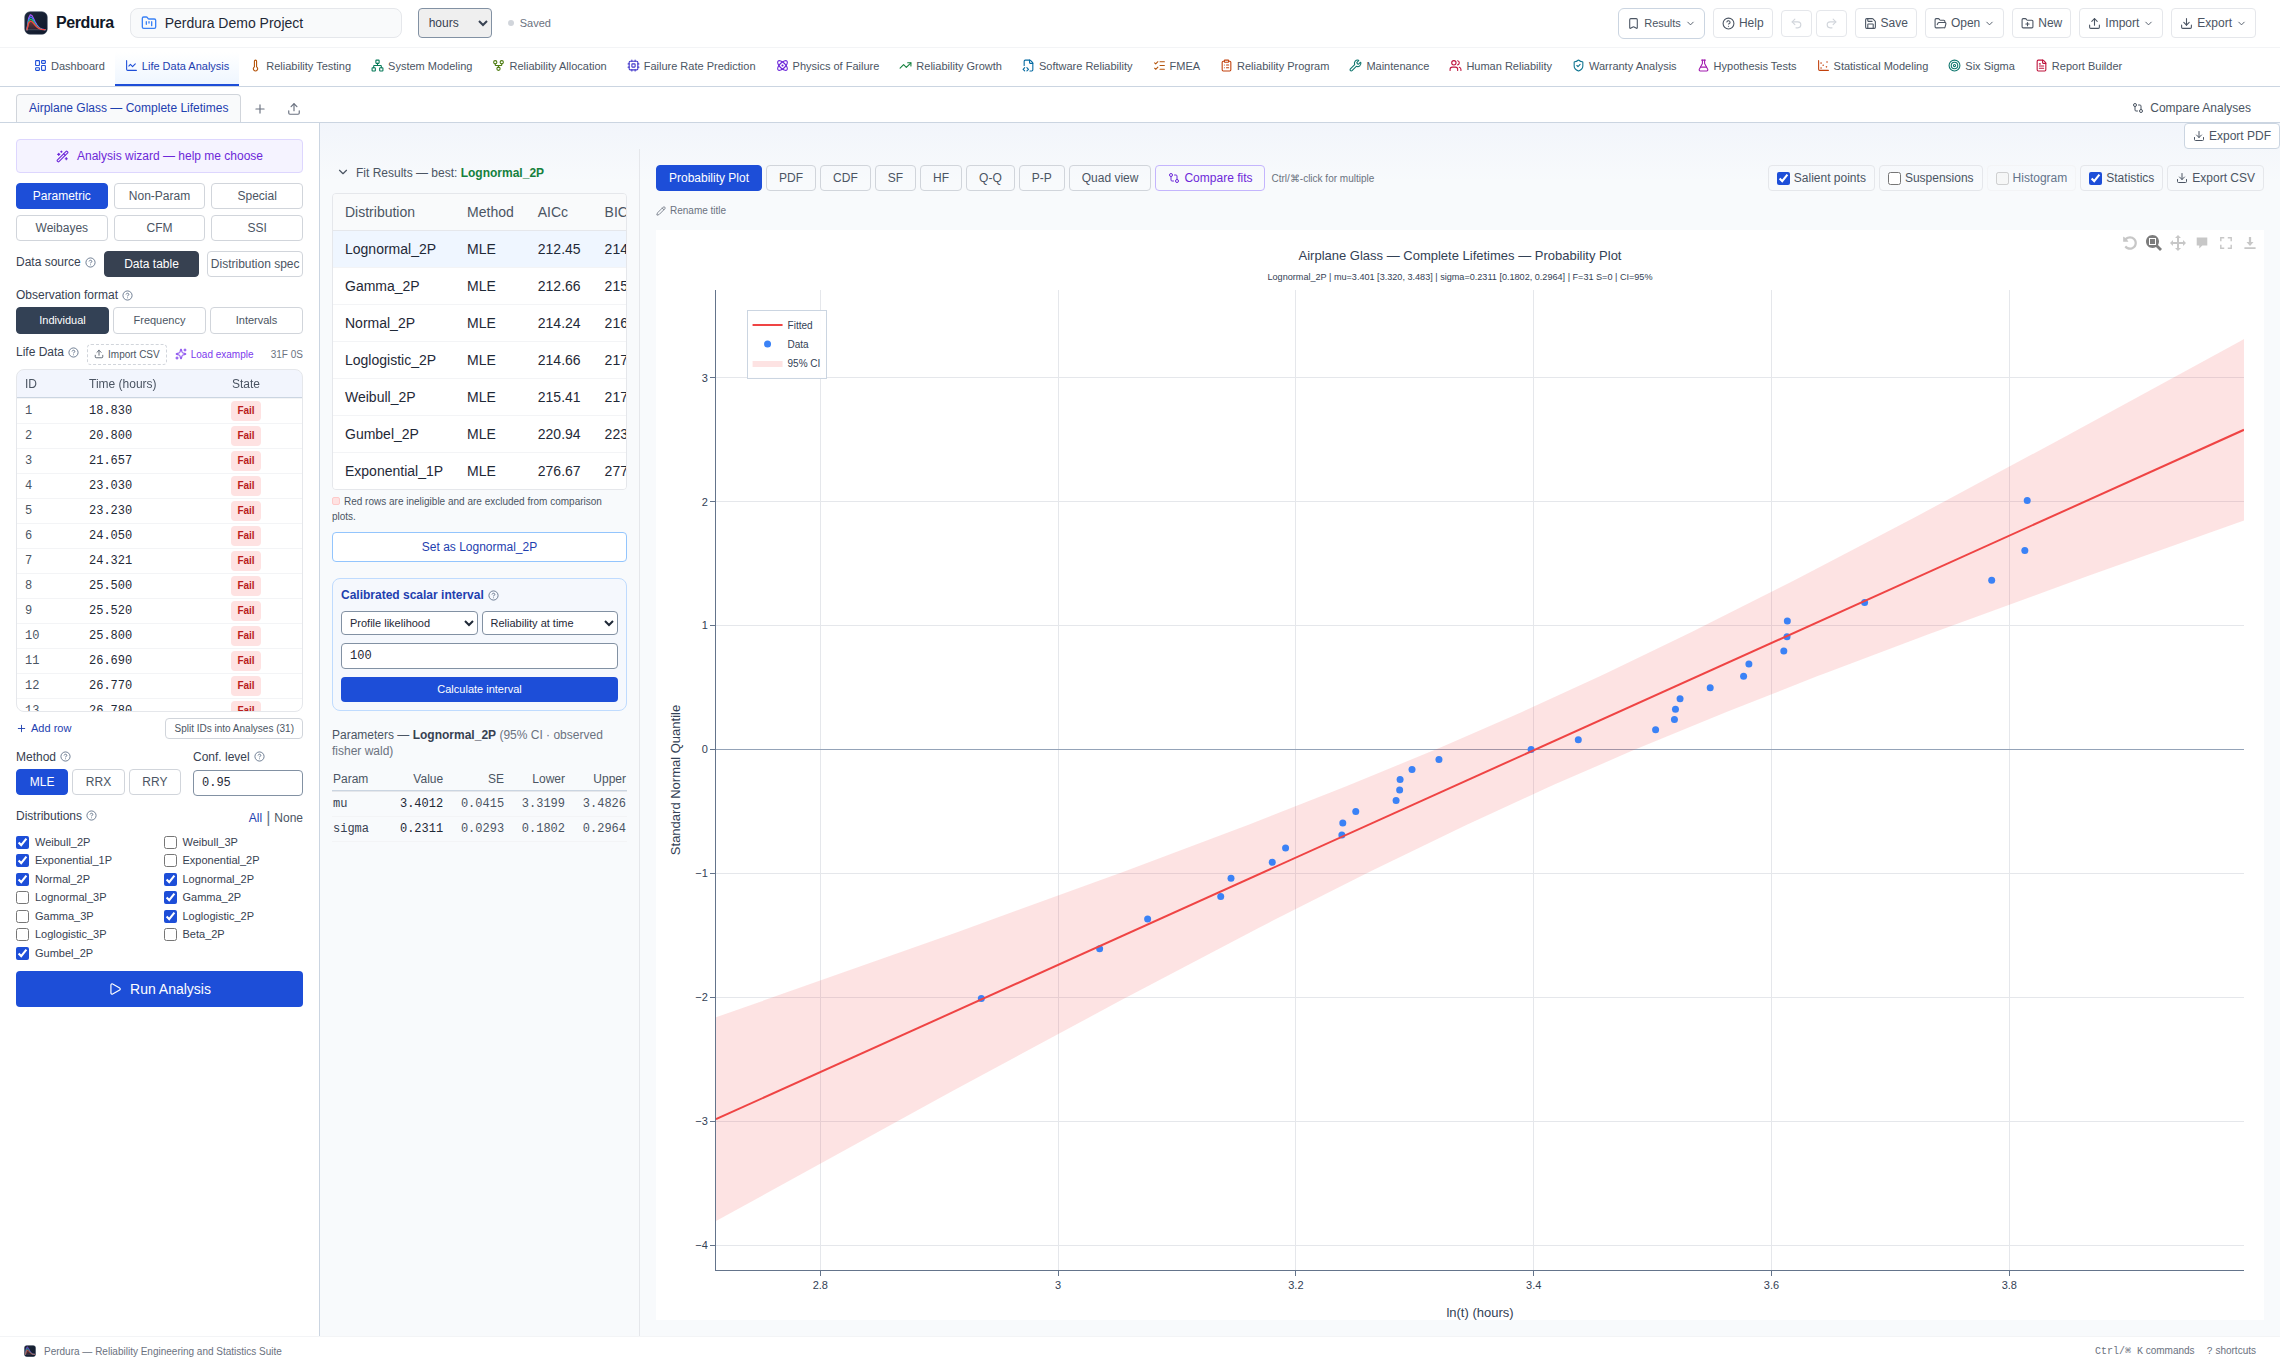
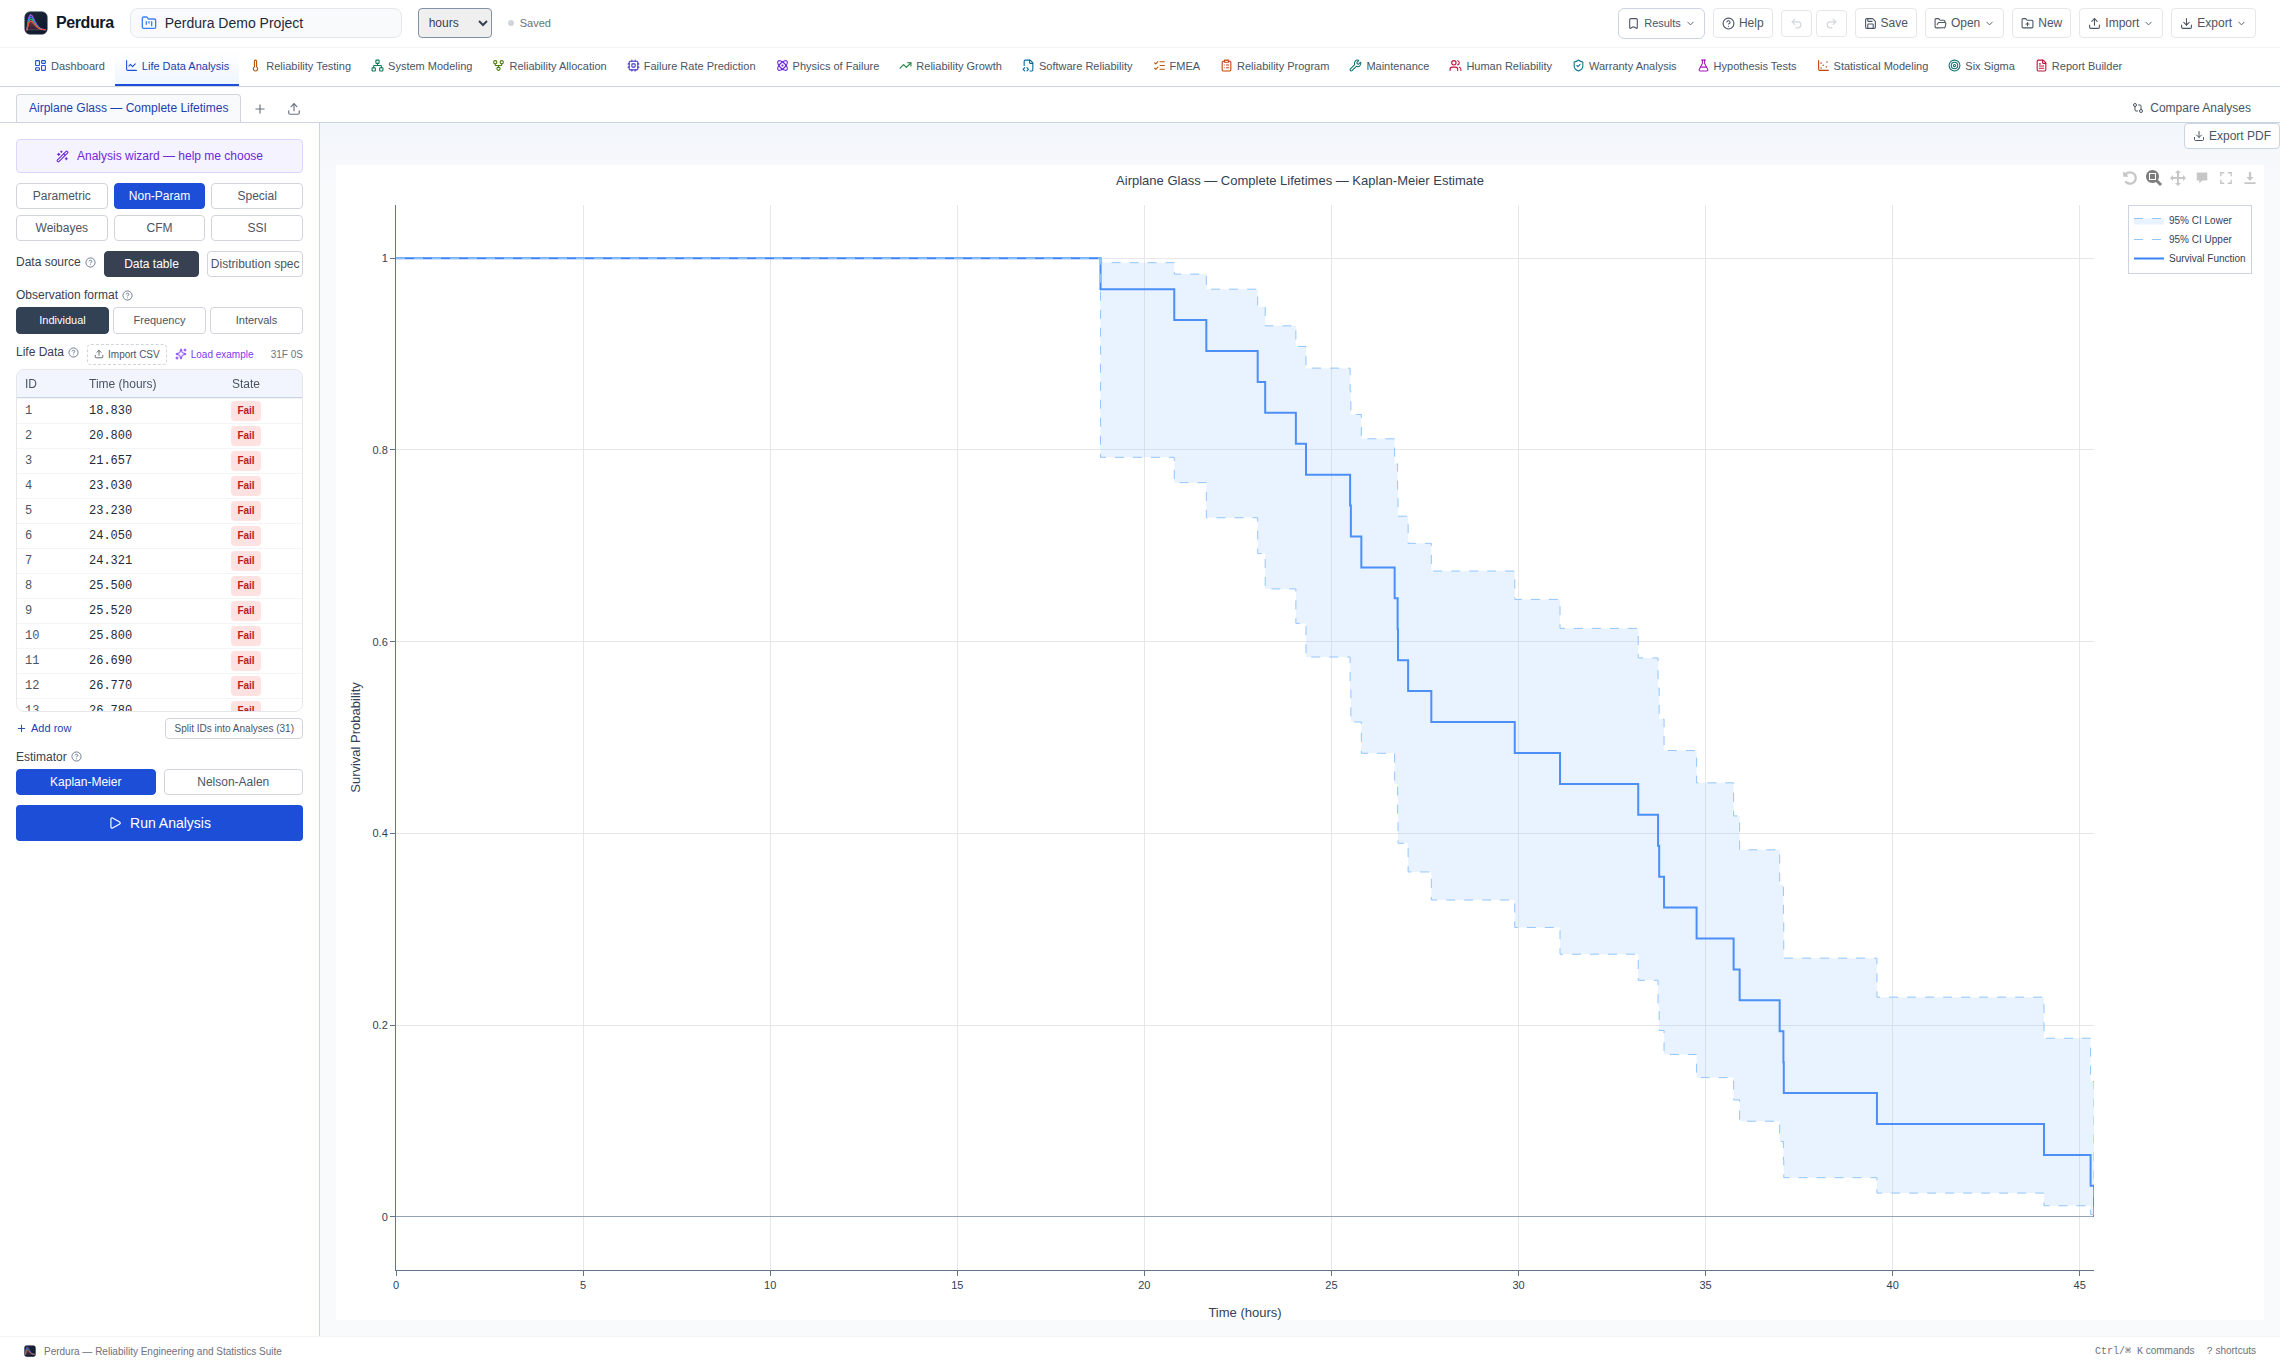
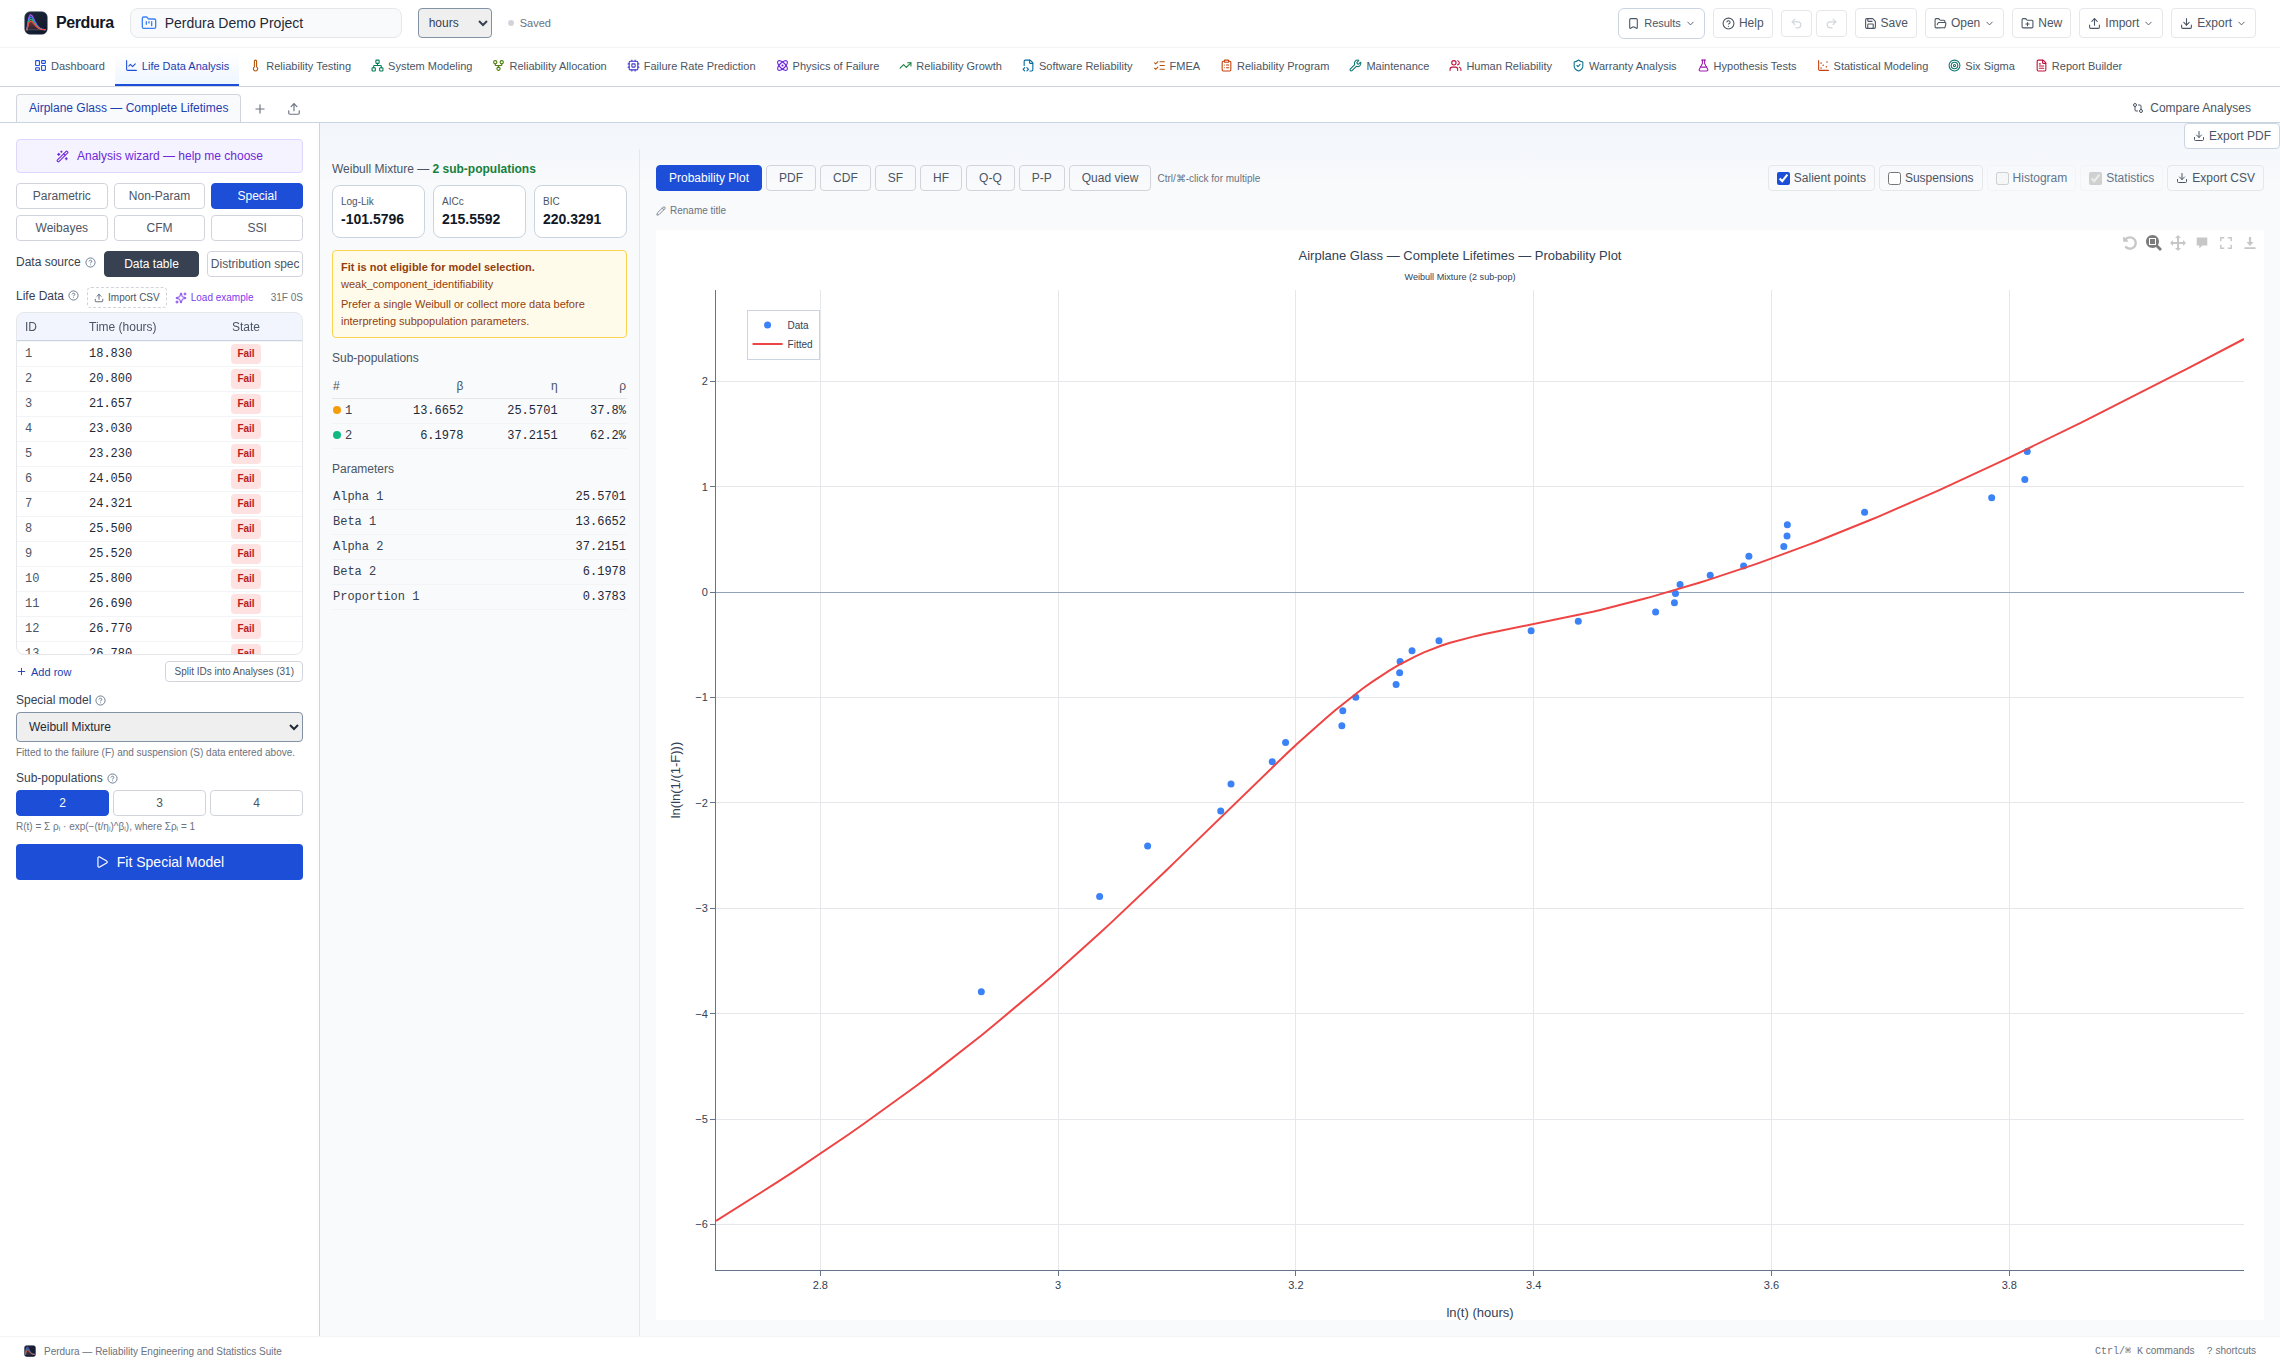
Estimate reliability from complete and censored life data, with eligibility checks, fit diagnostics and uncertainty.
- 13 parametric life distributions: Weibull (2P/3P), Exponential (1P/2P), Normal, Lognormal (2P/3P), Gamma (2P/3P), Loglogistic (2P/3P), Beta and Gumbel
- MLE, RRX and RRY parameter estimation for complete and right-censored data
- Eligible-model comparison by AICc, BIC and Anderson–Darling, supported by probability, Q–Q and P–P diagnostics
- Weibull mixture, competing-risks, DSZI and grouped models with parameter confidence intervals
- Kaplan–Meier and Nelson–Aalen non-parametric estimates; stress–strength interference; R(t), F(t), f(t) and h(t)
- Analysis comparison using each analysis’s selected fit, with confidence contours and distribution-to-distribution interference
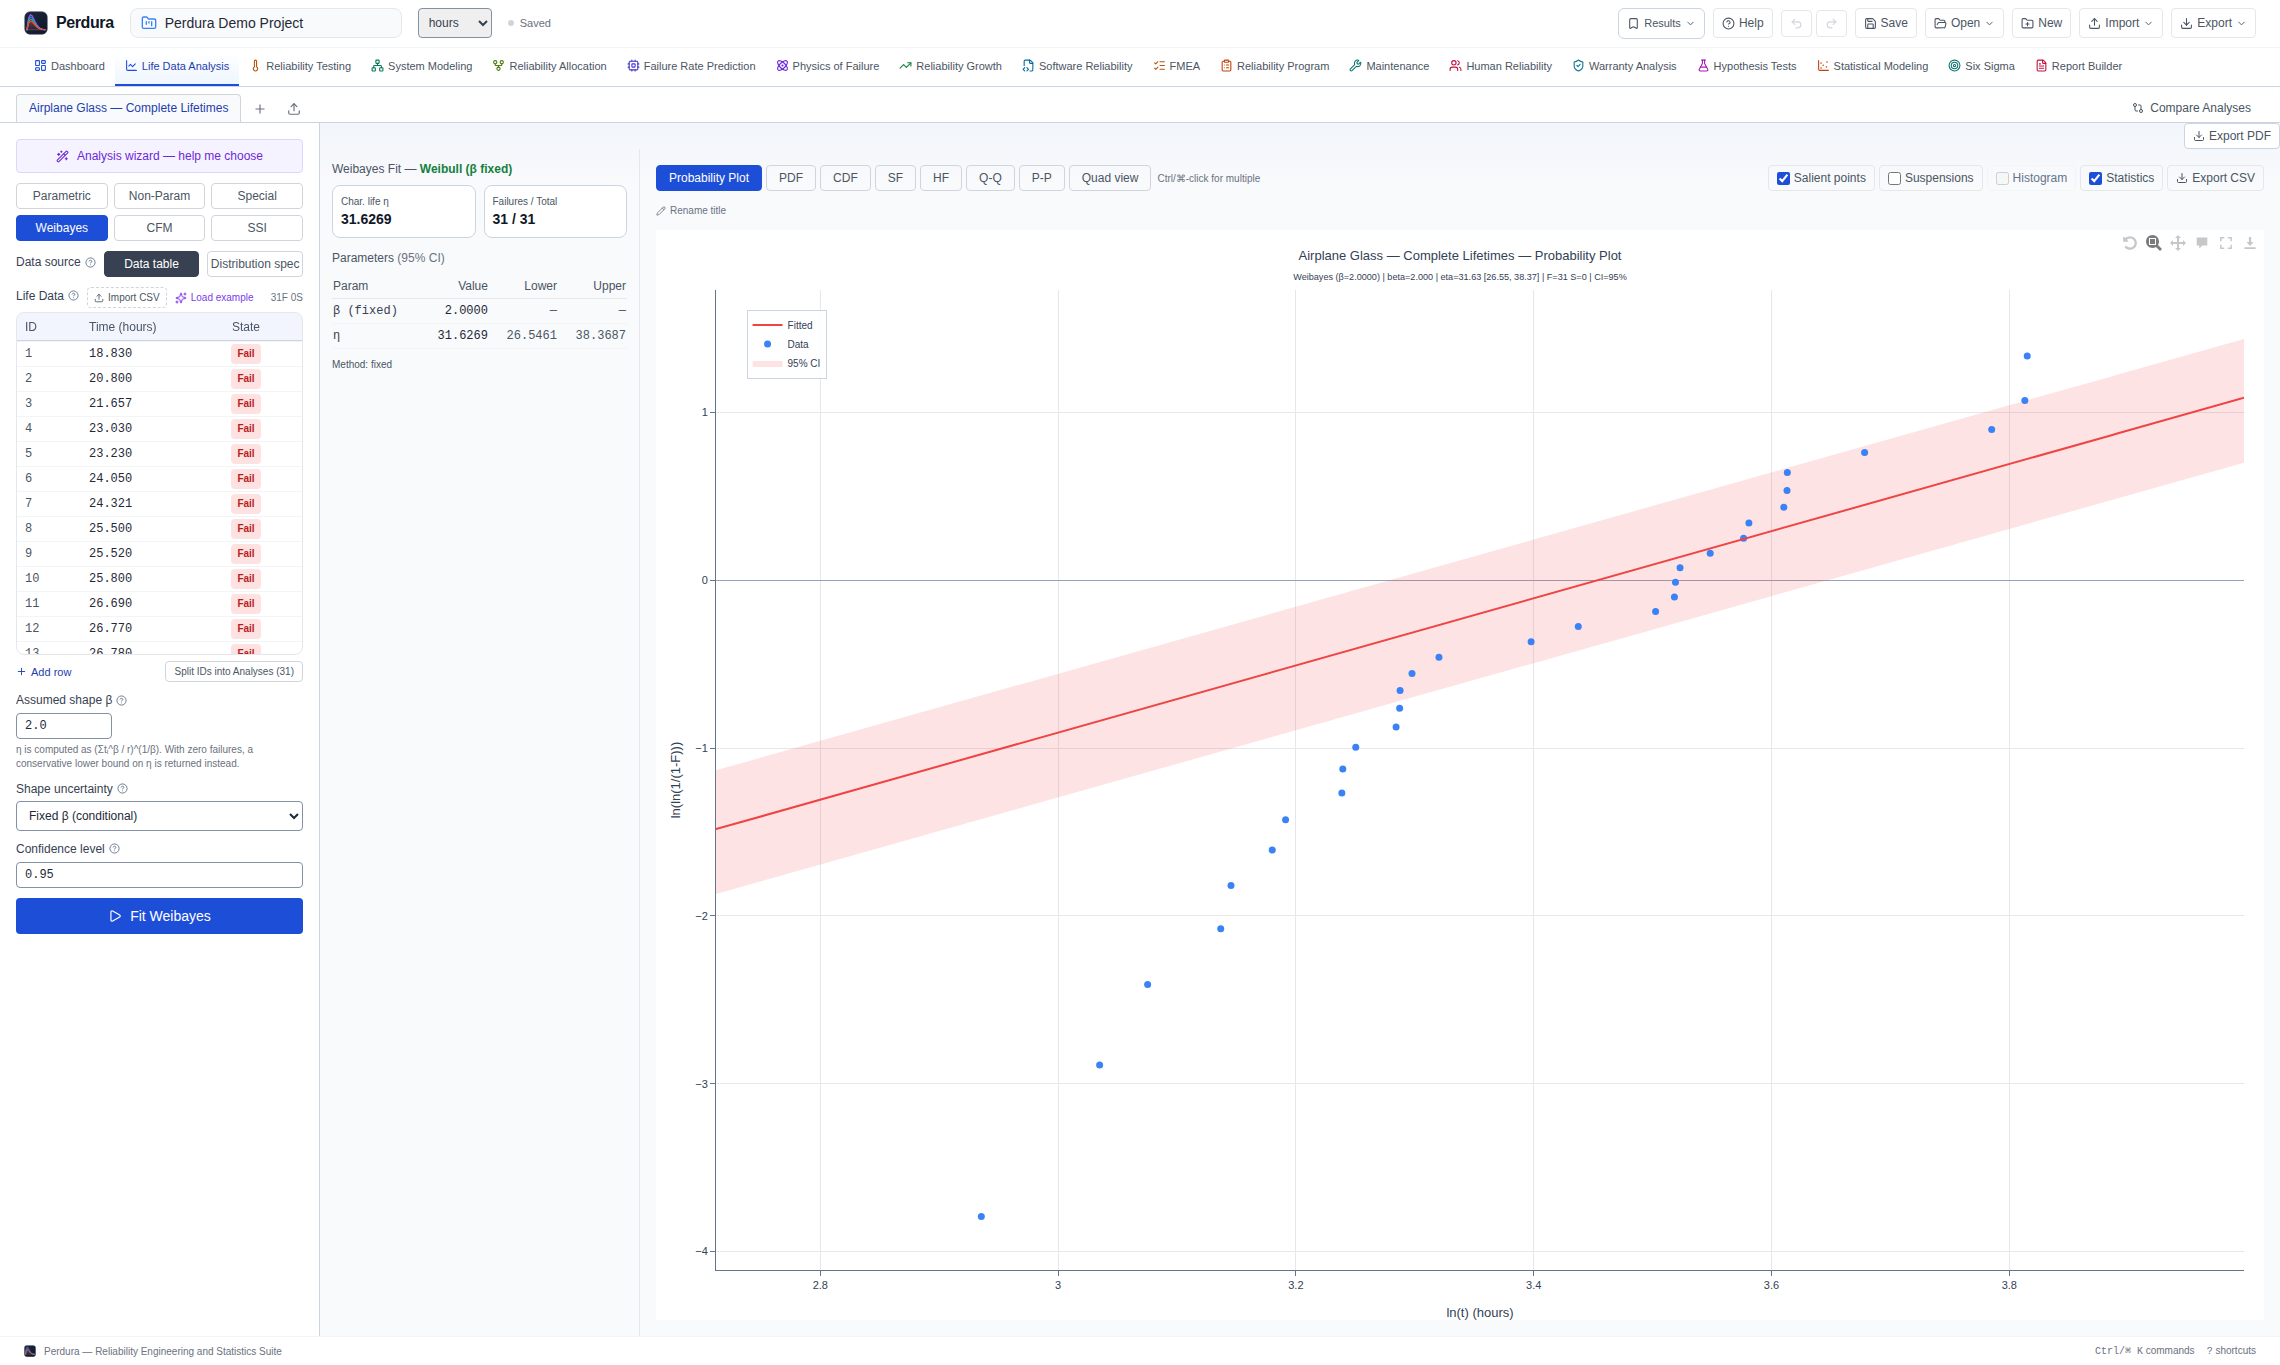
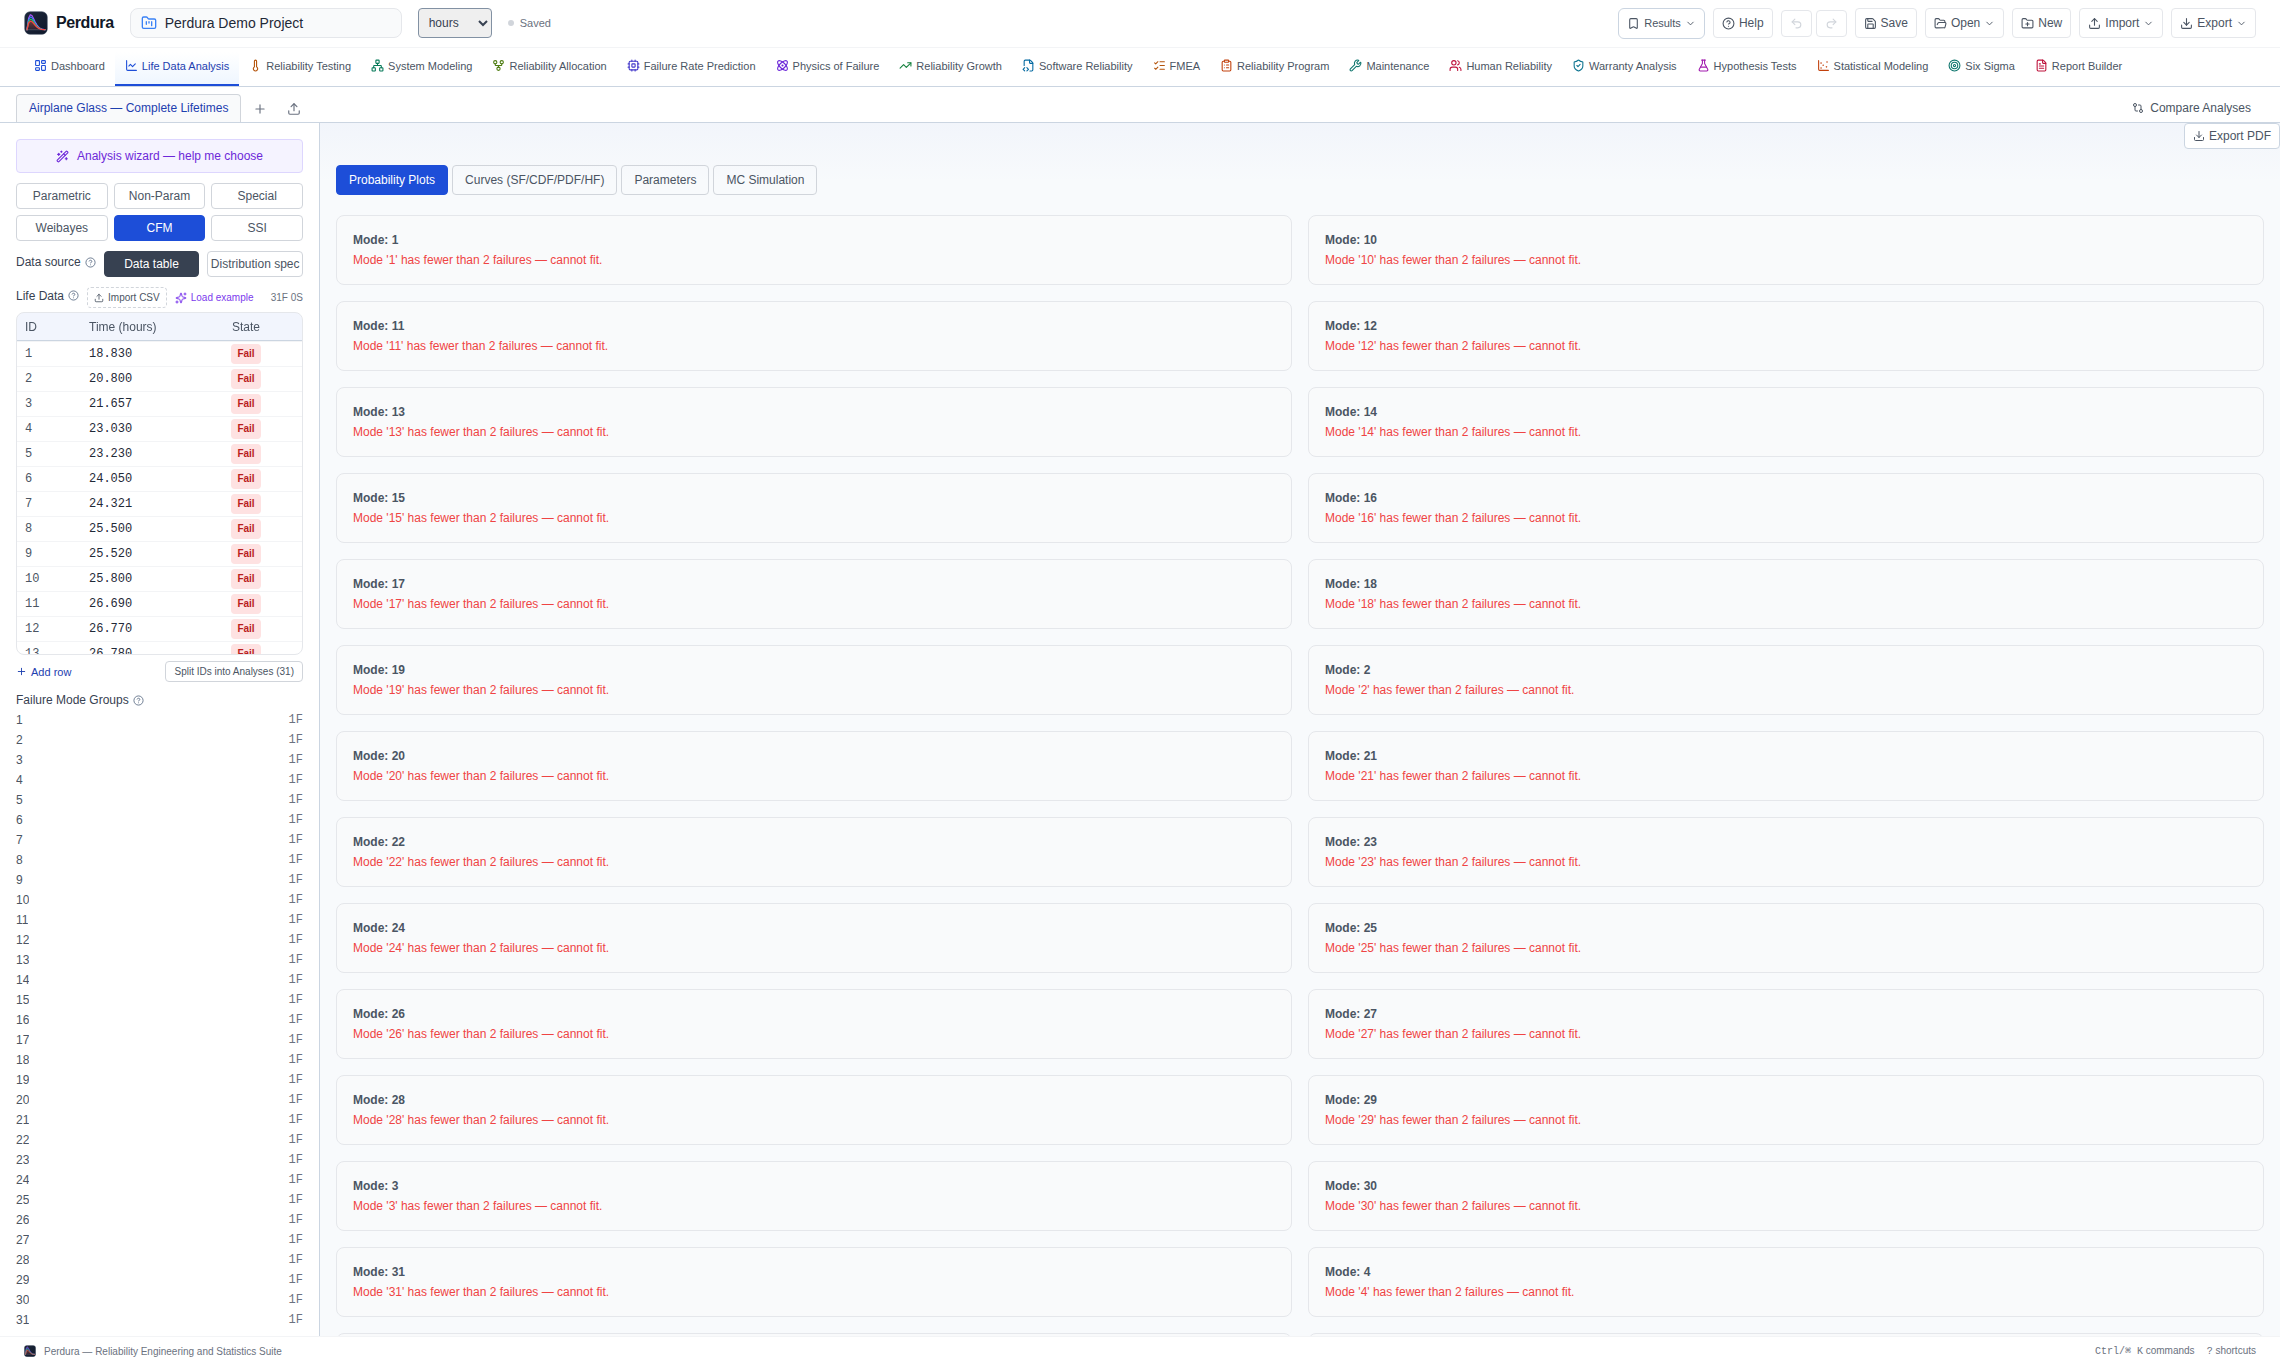
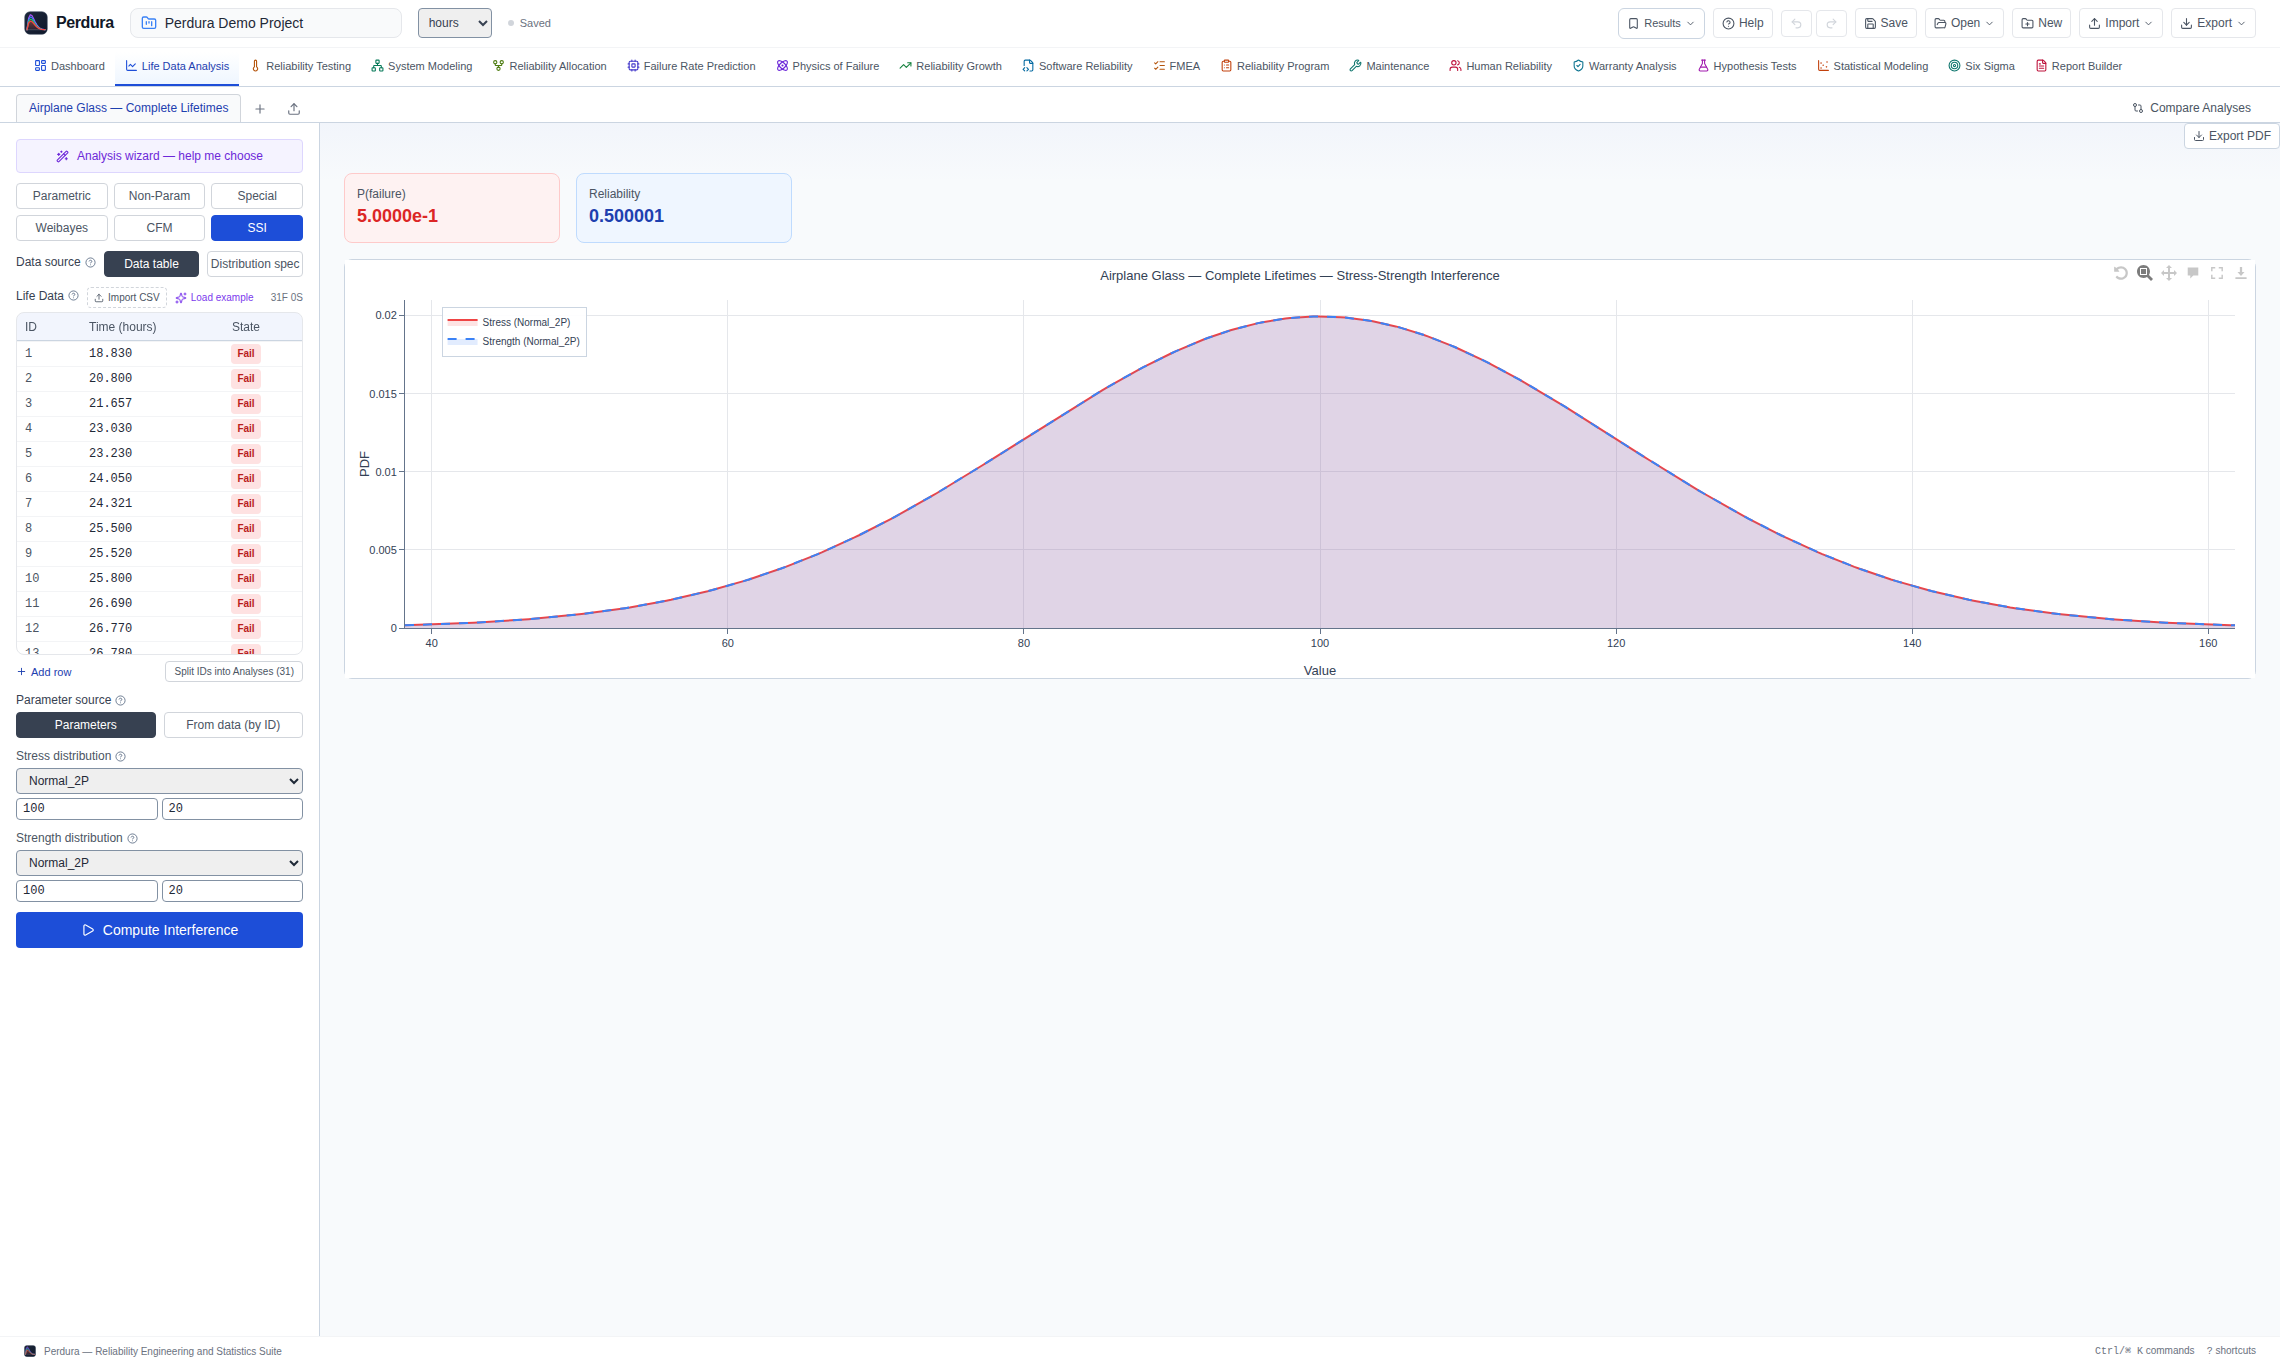
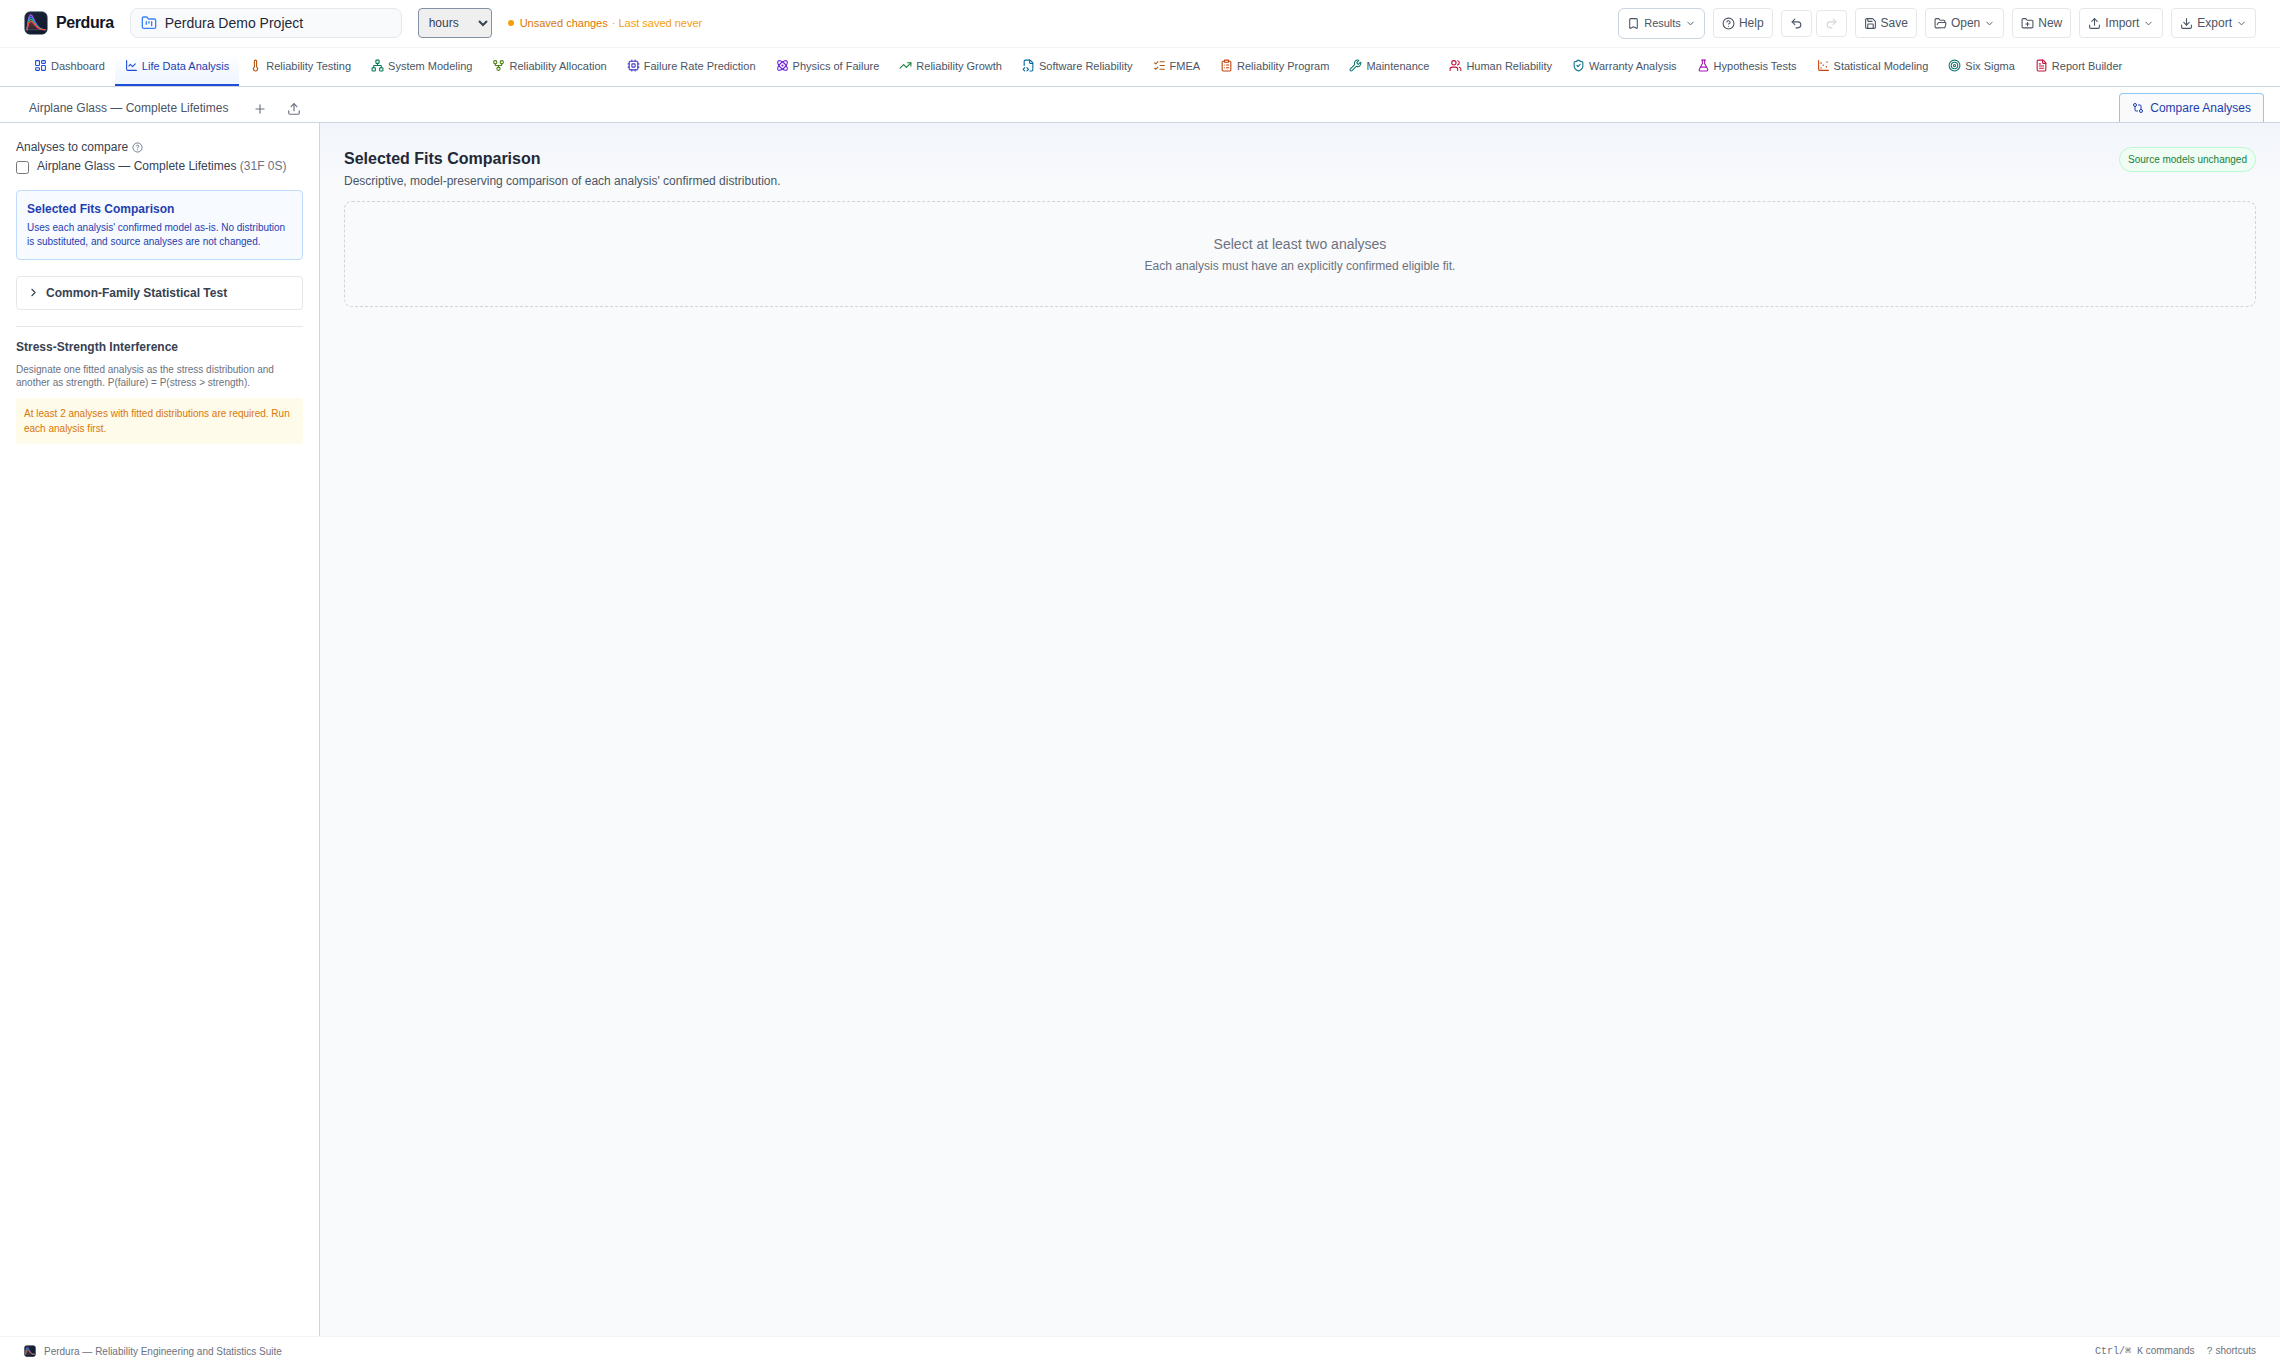
Use the arrows, arrow keys, or swipe to review each analysis. Open an image for full resolution.
Accelerated Life Testing (ALT)
Relate life to environmental and use stresses, then extrapolate reliability at conditions of use.
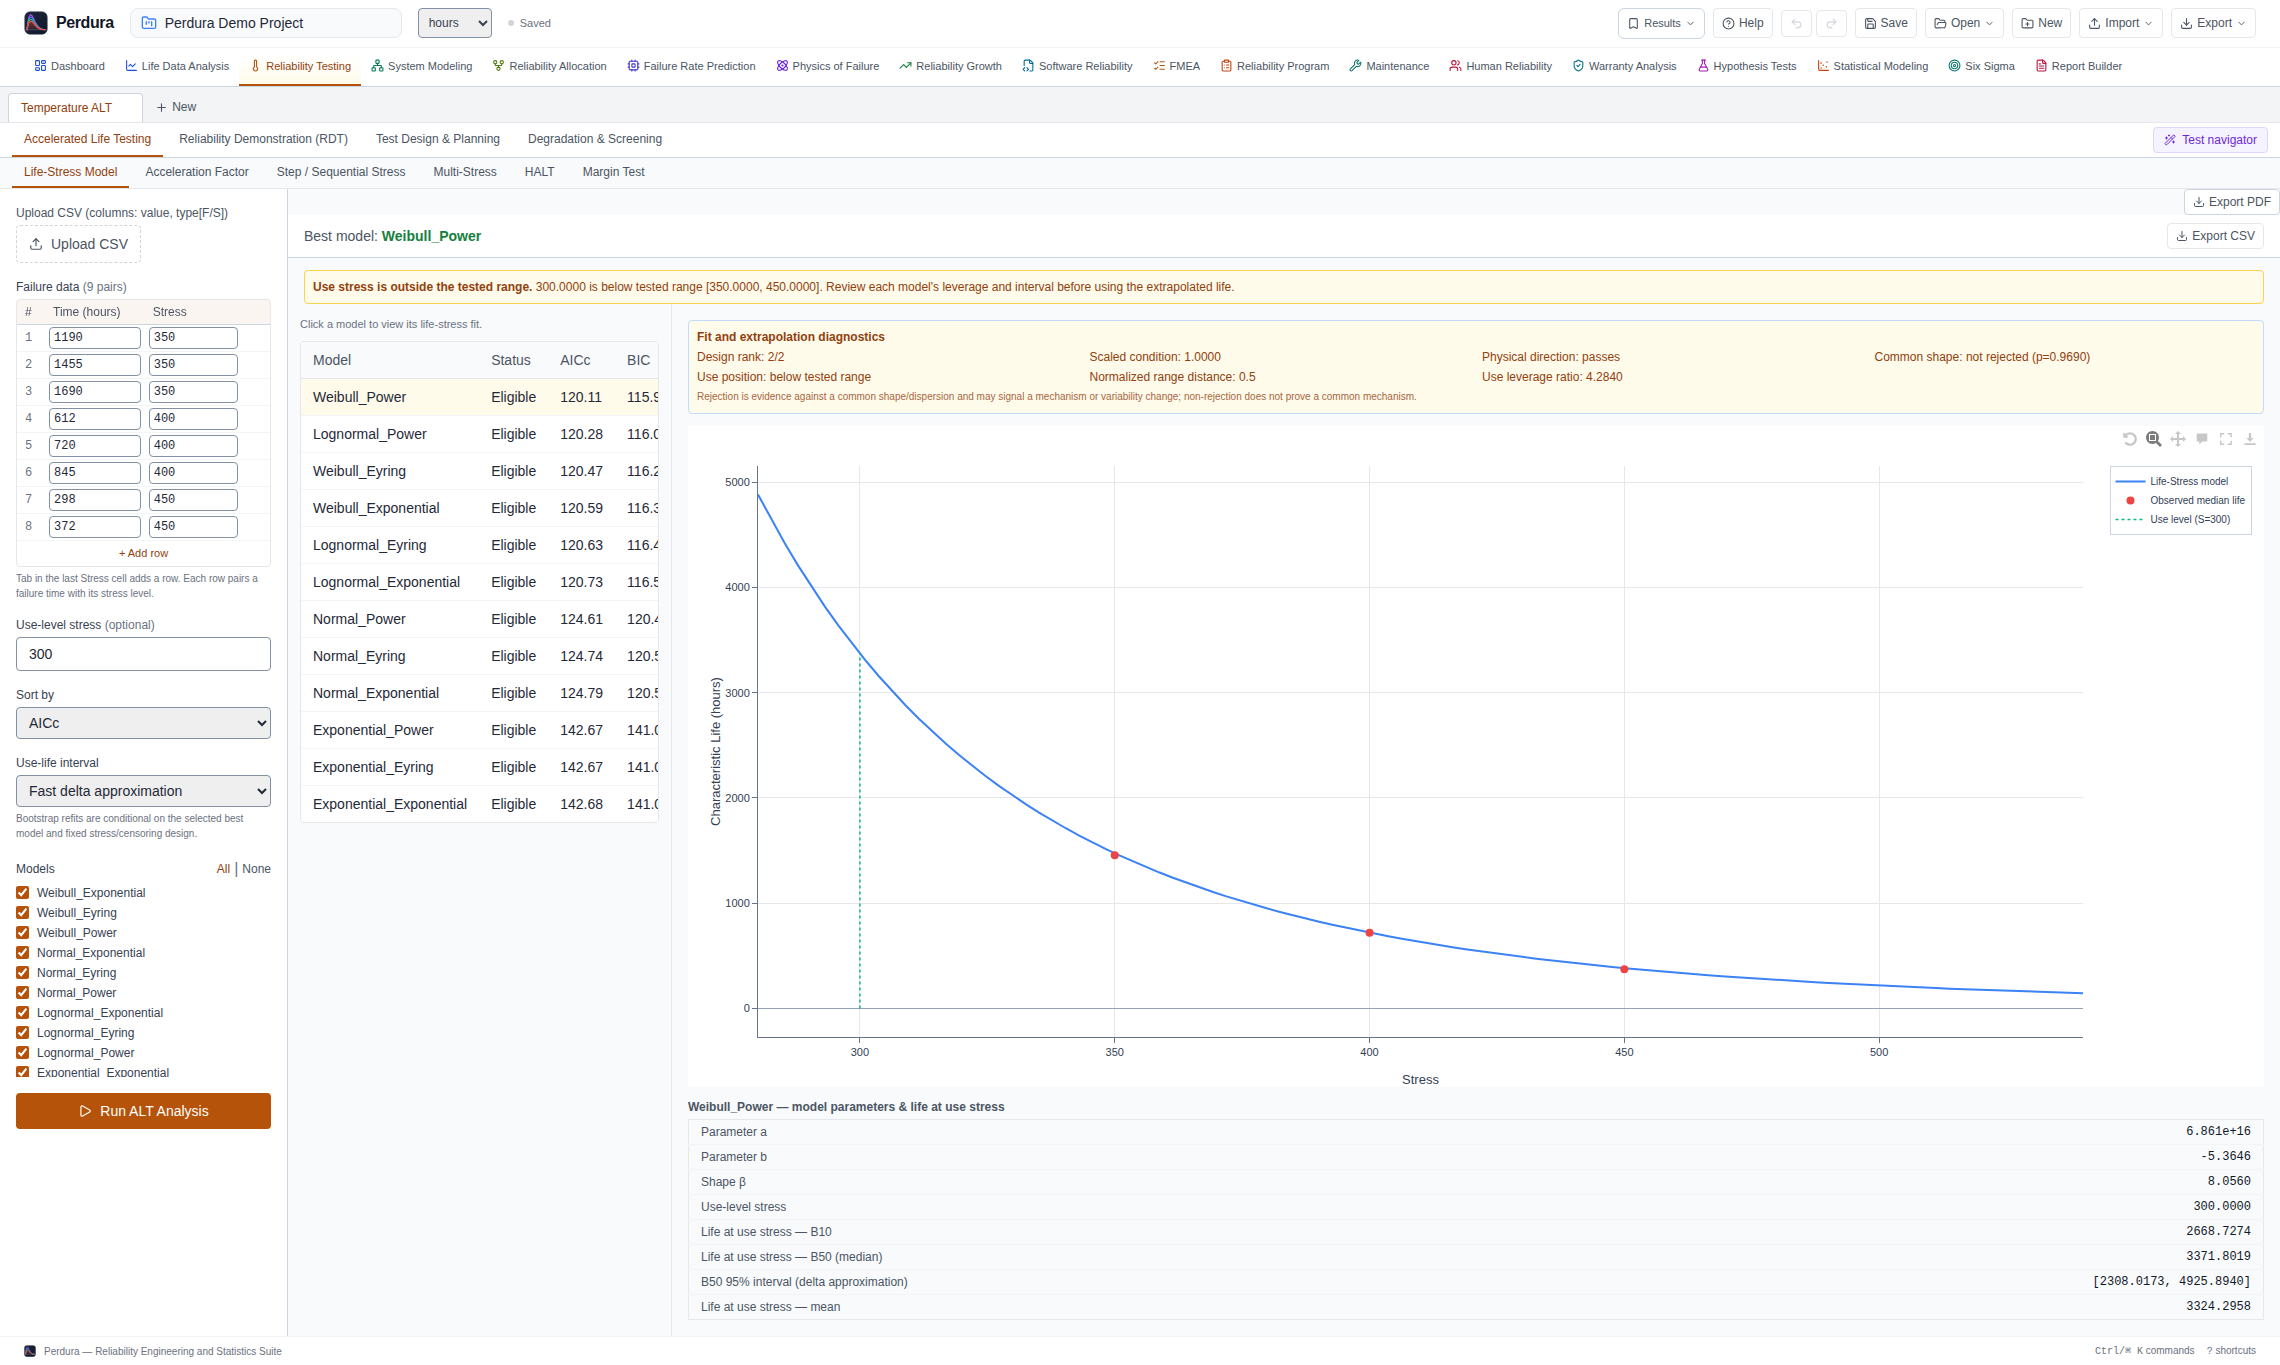
- 24 accelerated-life models: 6 life–stress relationships × 4 life distributions
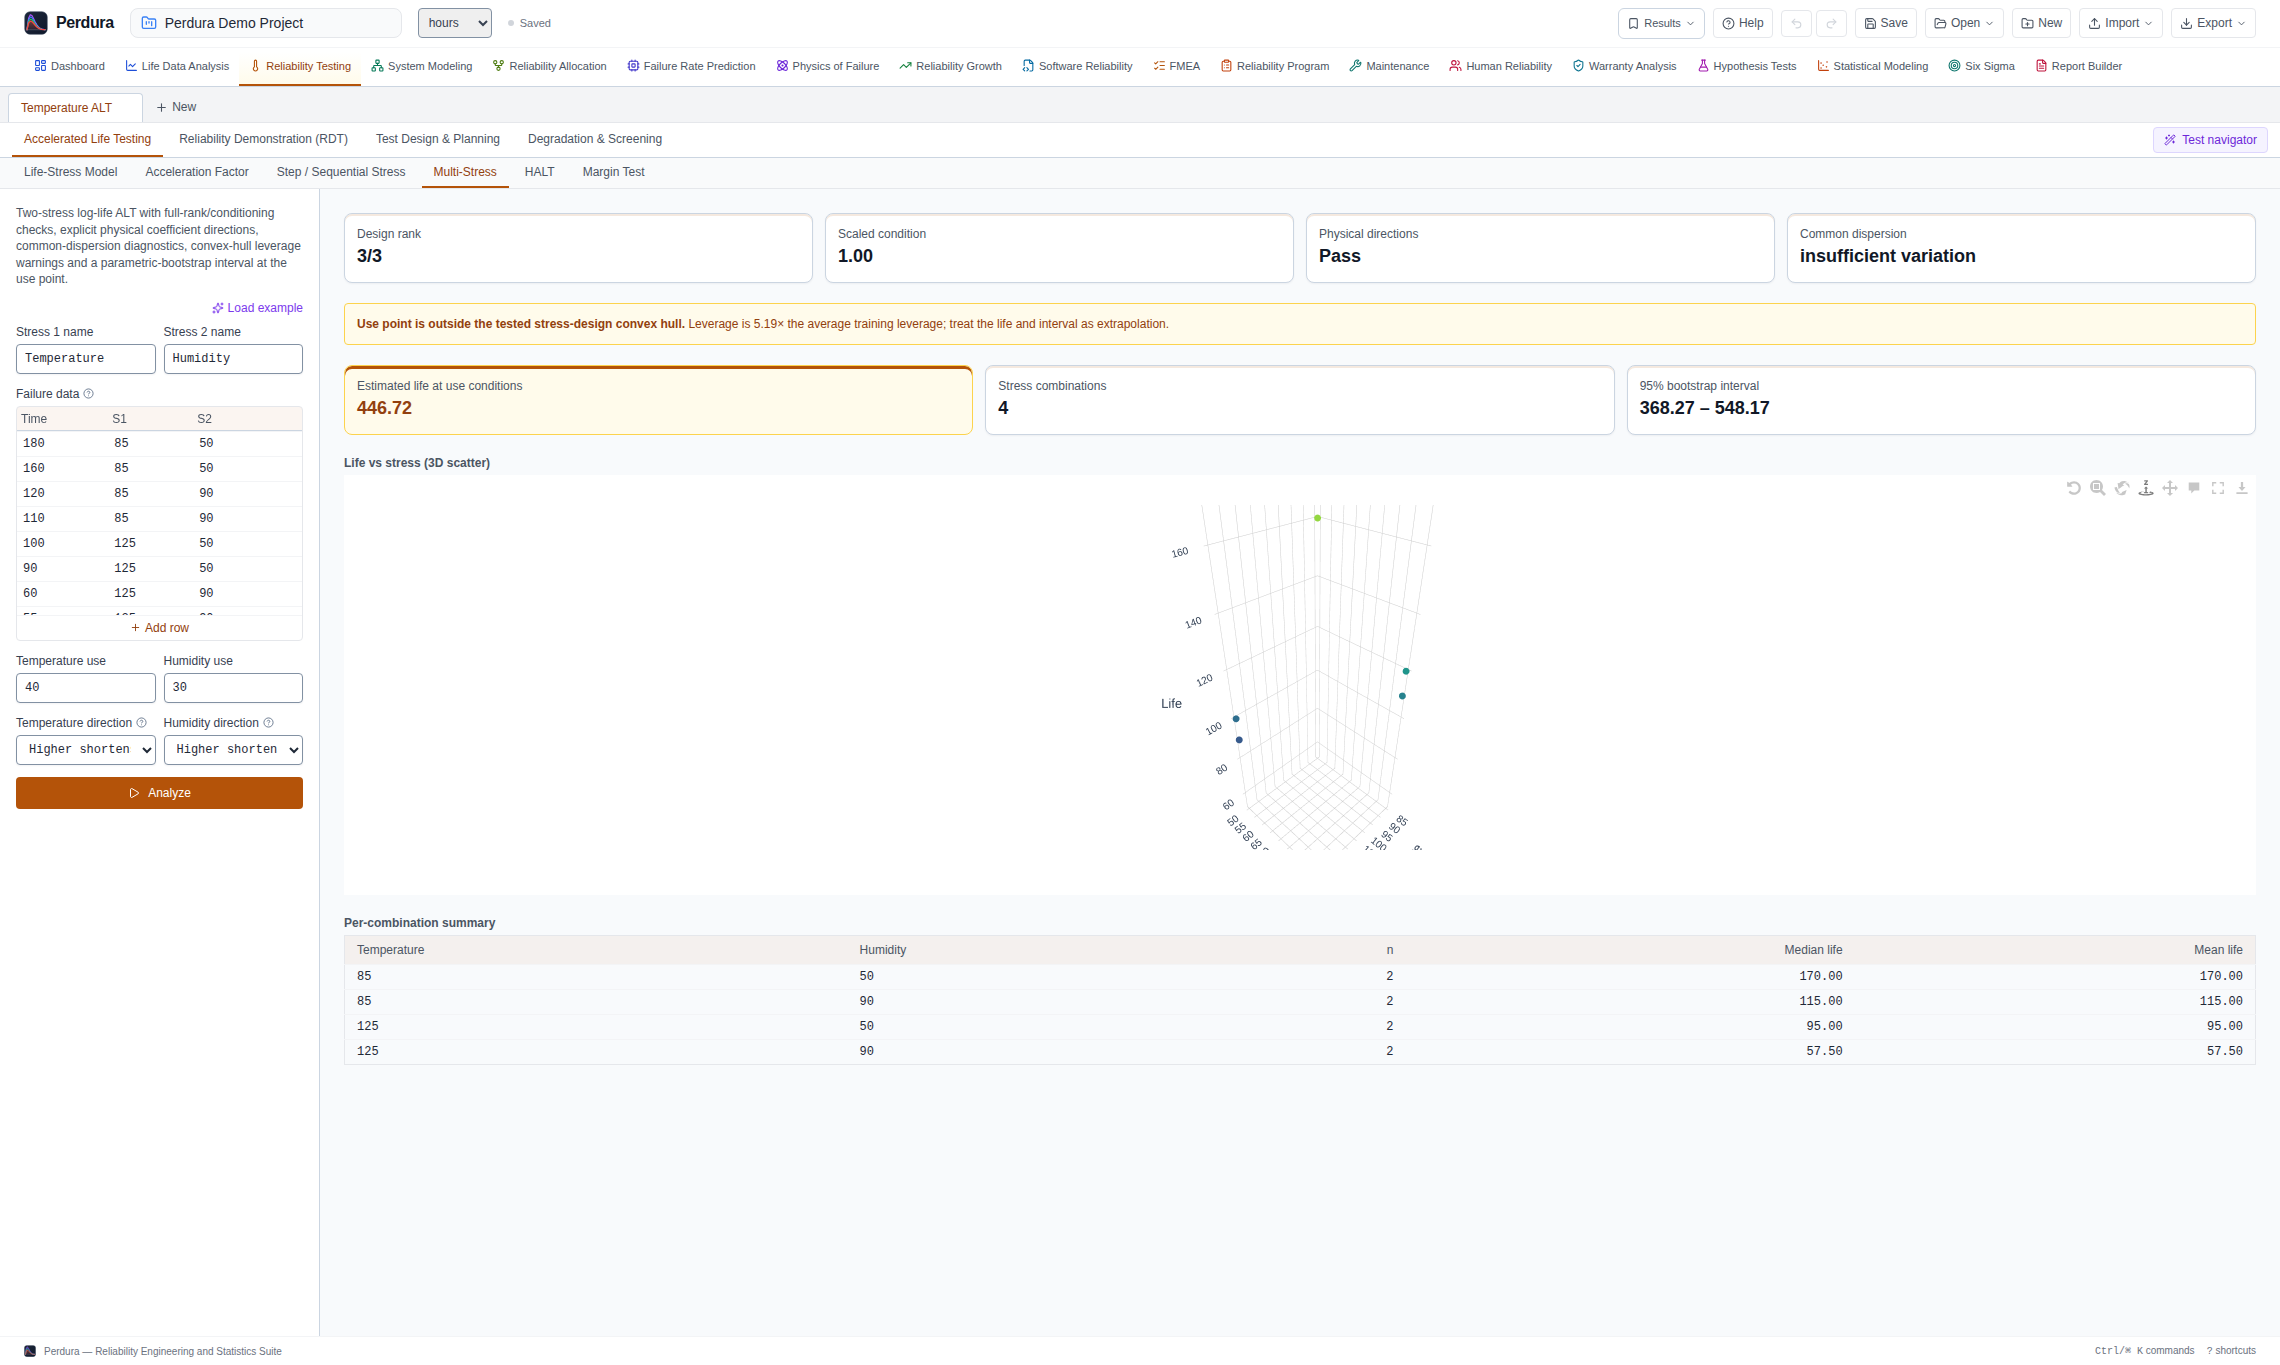
- Arrhenius, Eyring, Power (IPL), Dual-Exponential, Power-Exponential and Dual-Power models
- Model comparison with tested-range, leverage, design-rank and extrapolation diagnostics
- Delta-method and refitted parametric-bootstrap uncertainty for supported use-level life projections
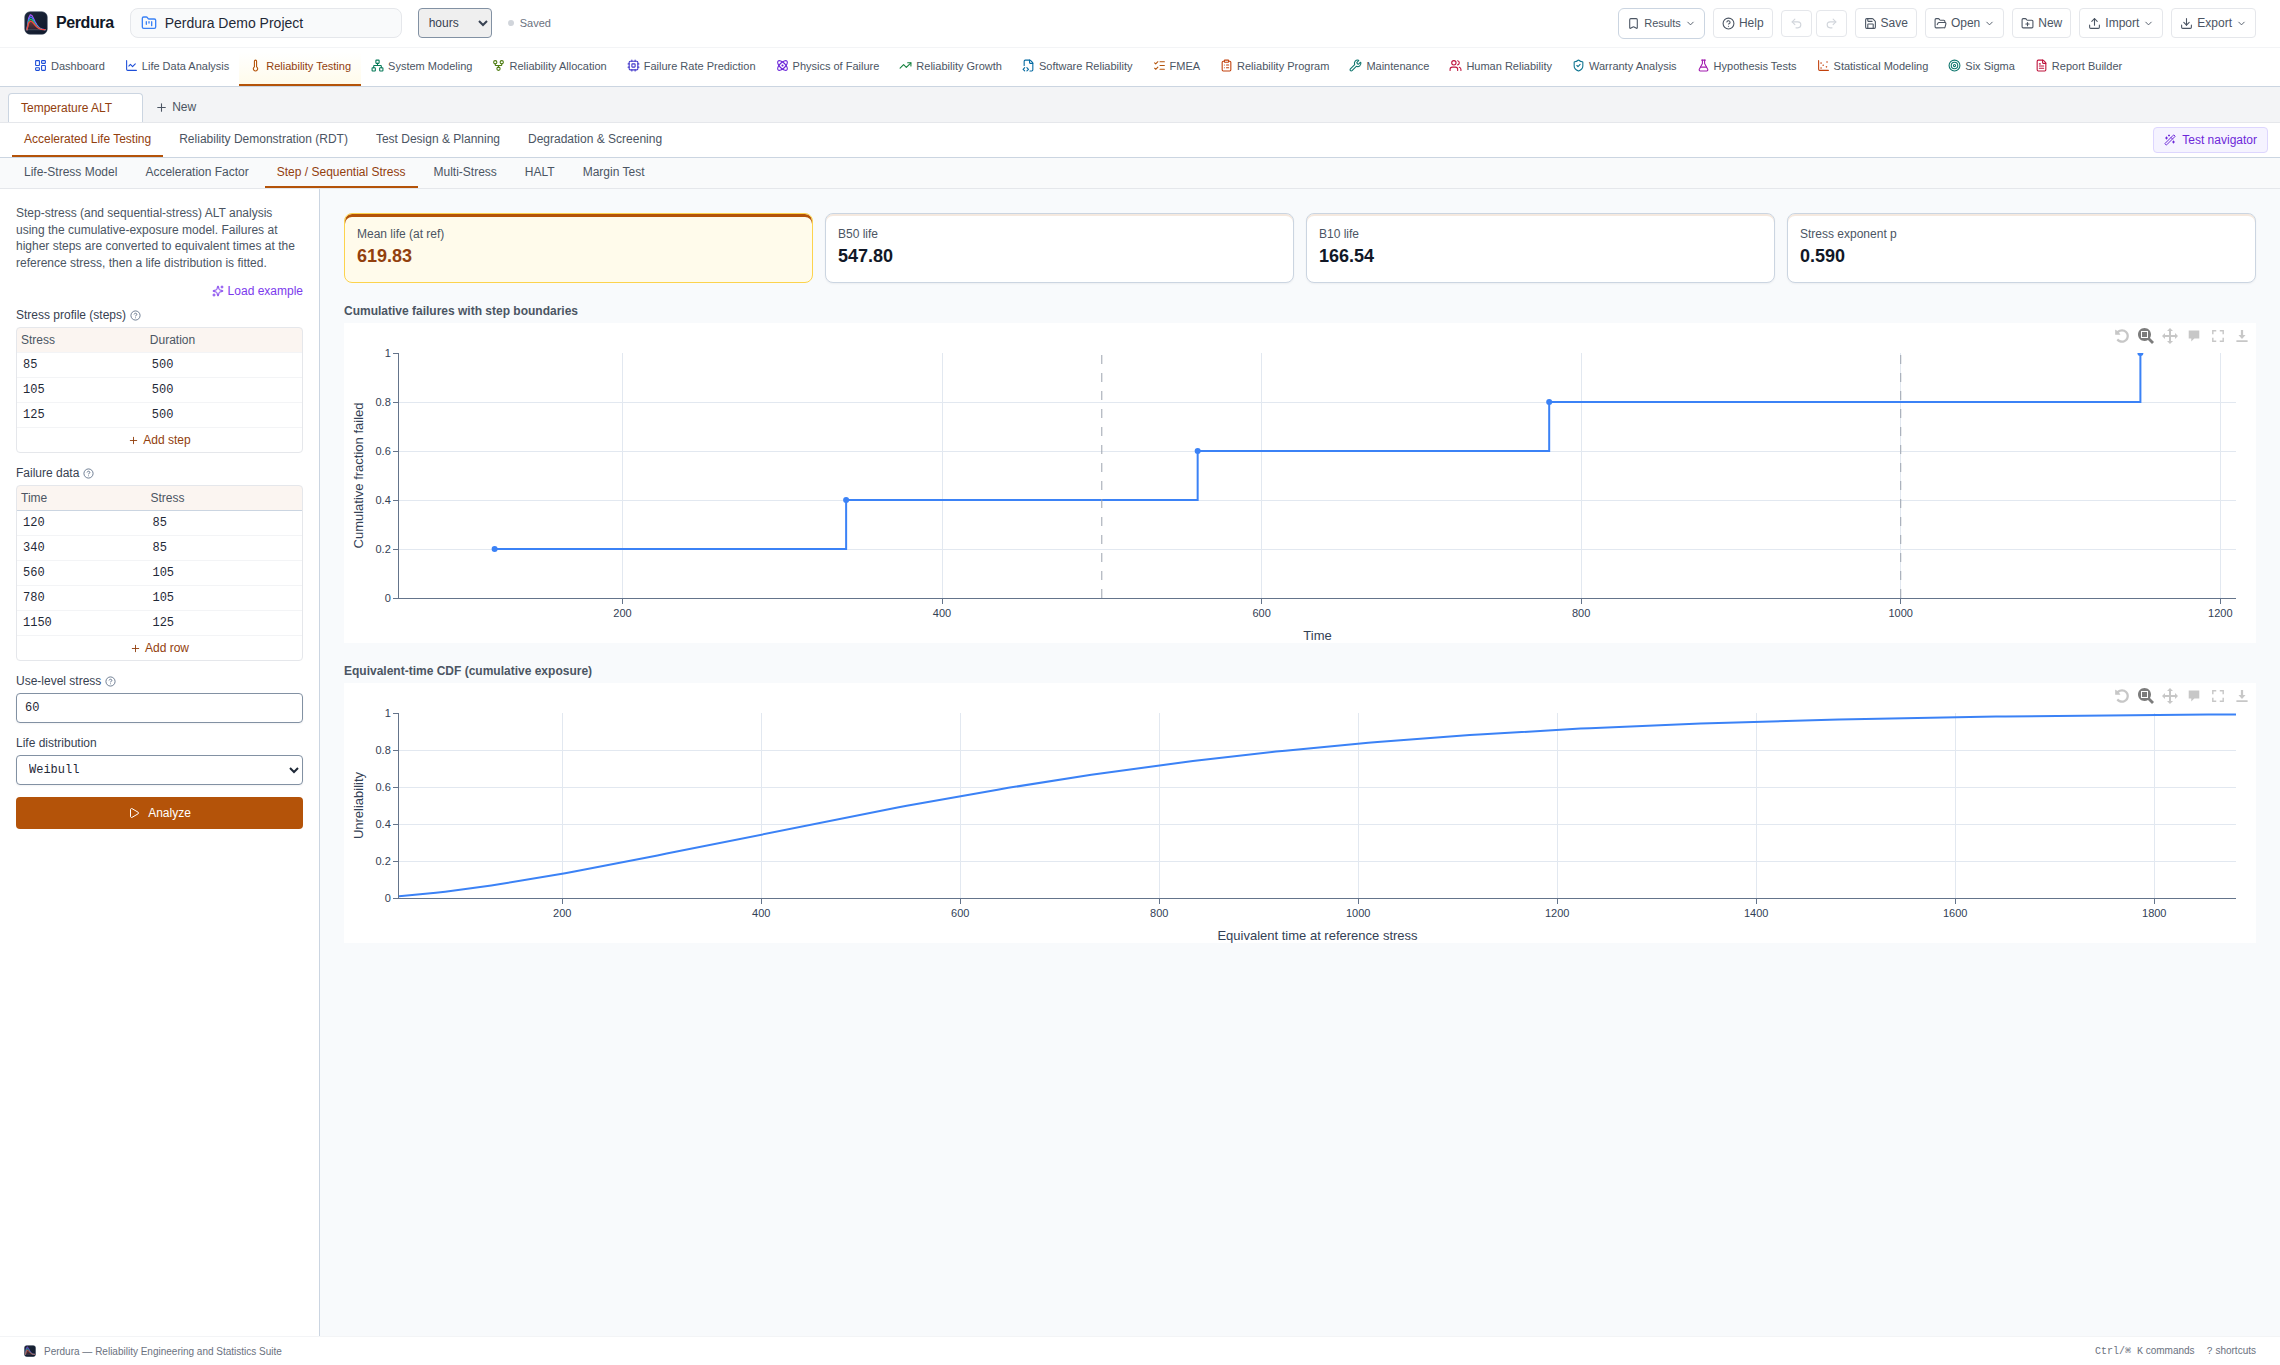
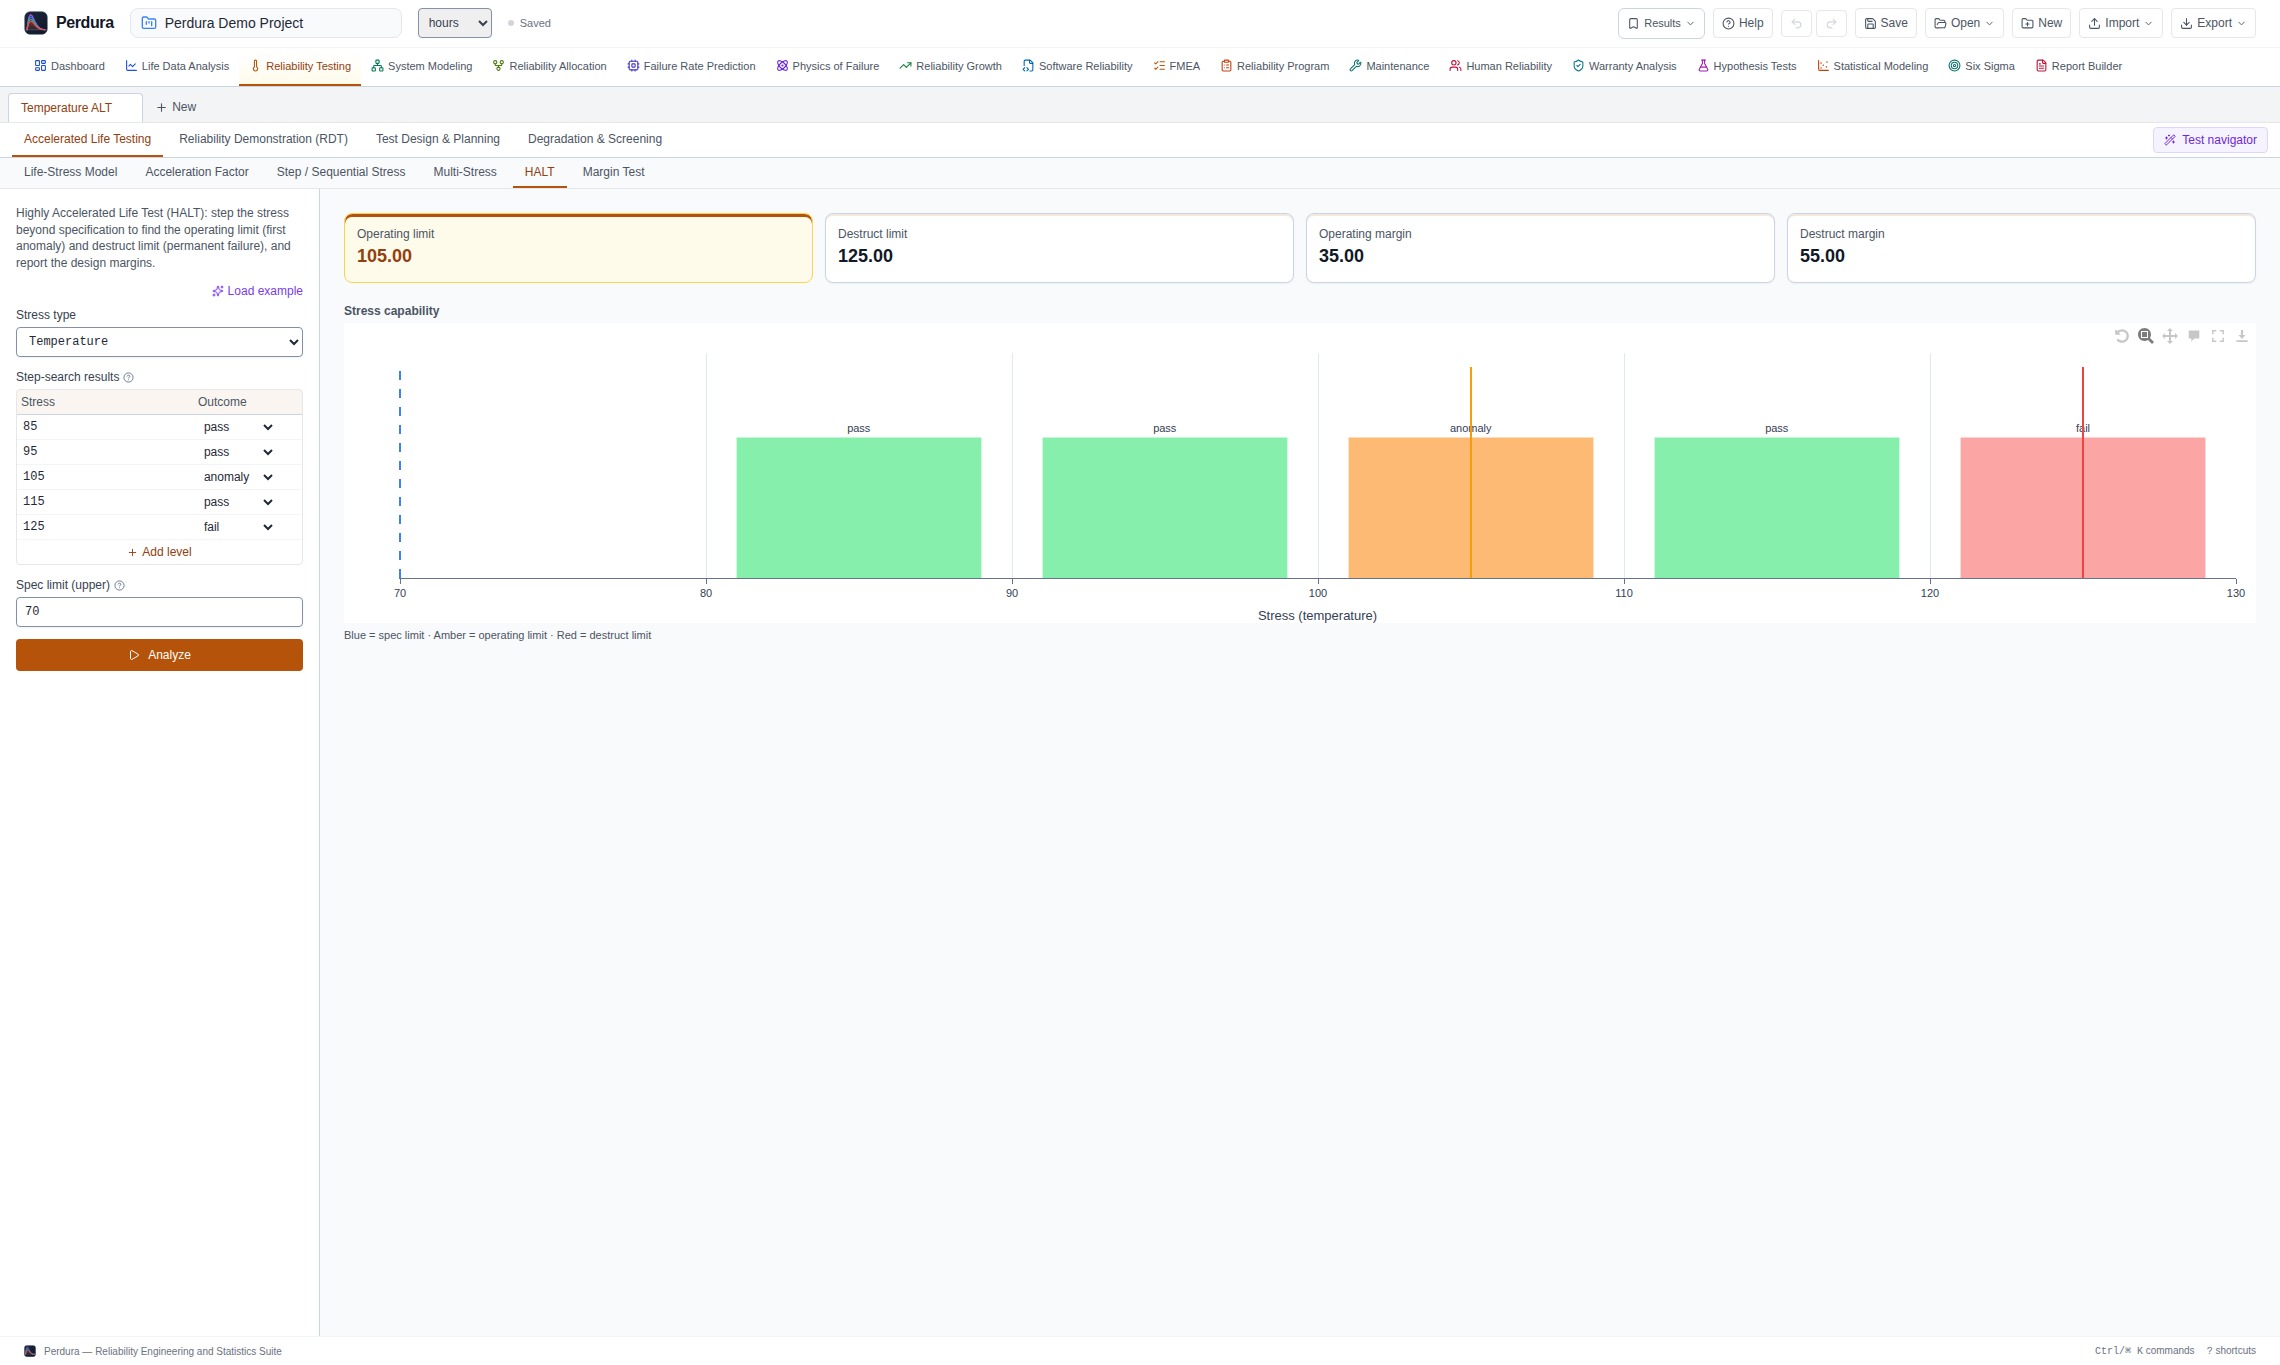
- Test planning for expected failure times, sequential and step-stress tests, HALT and operating-characteristic curves
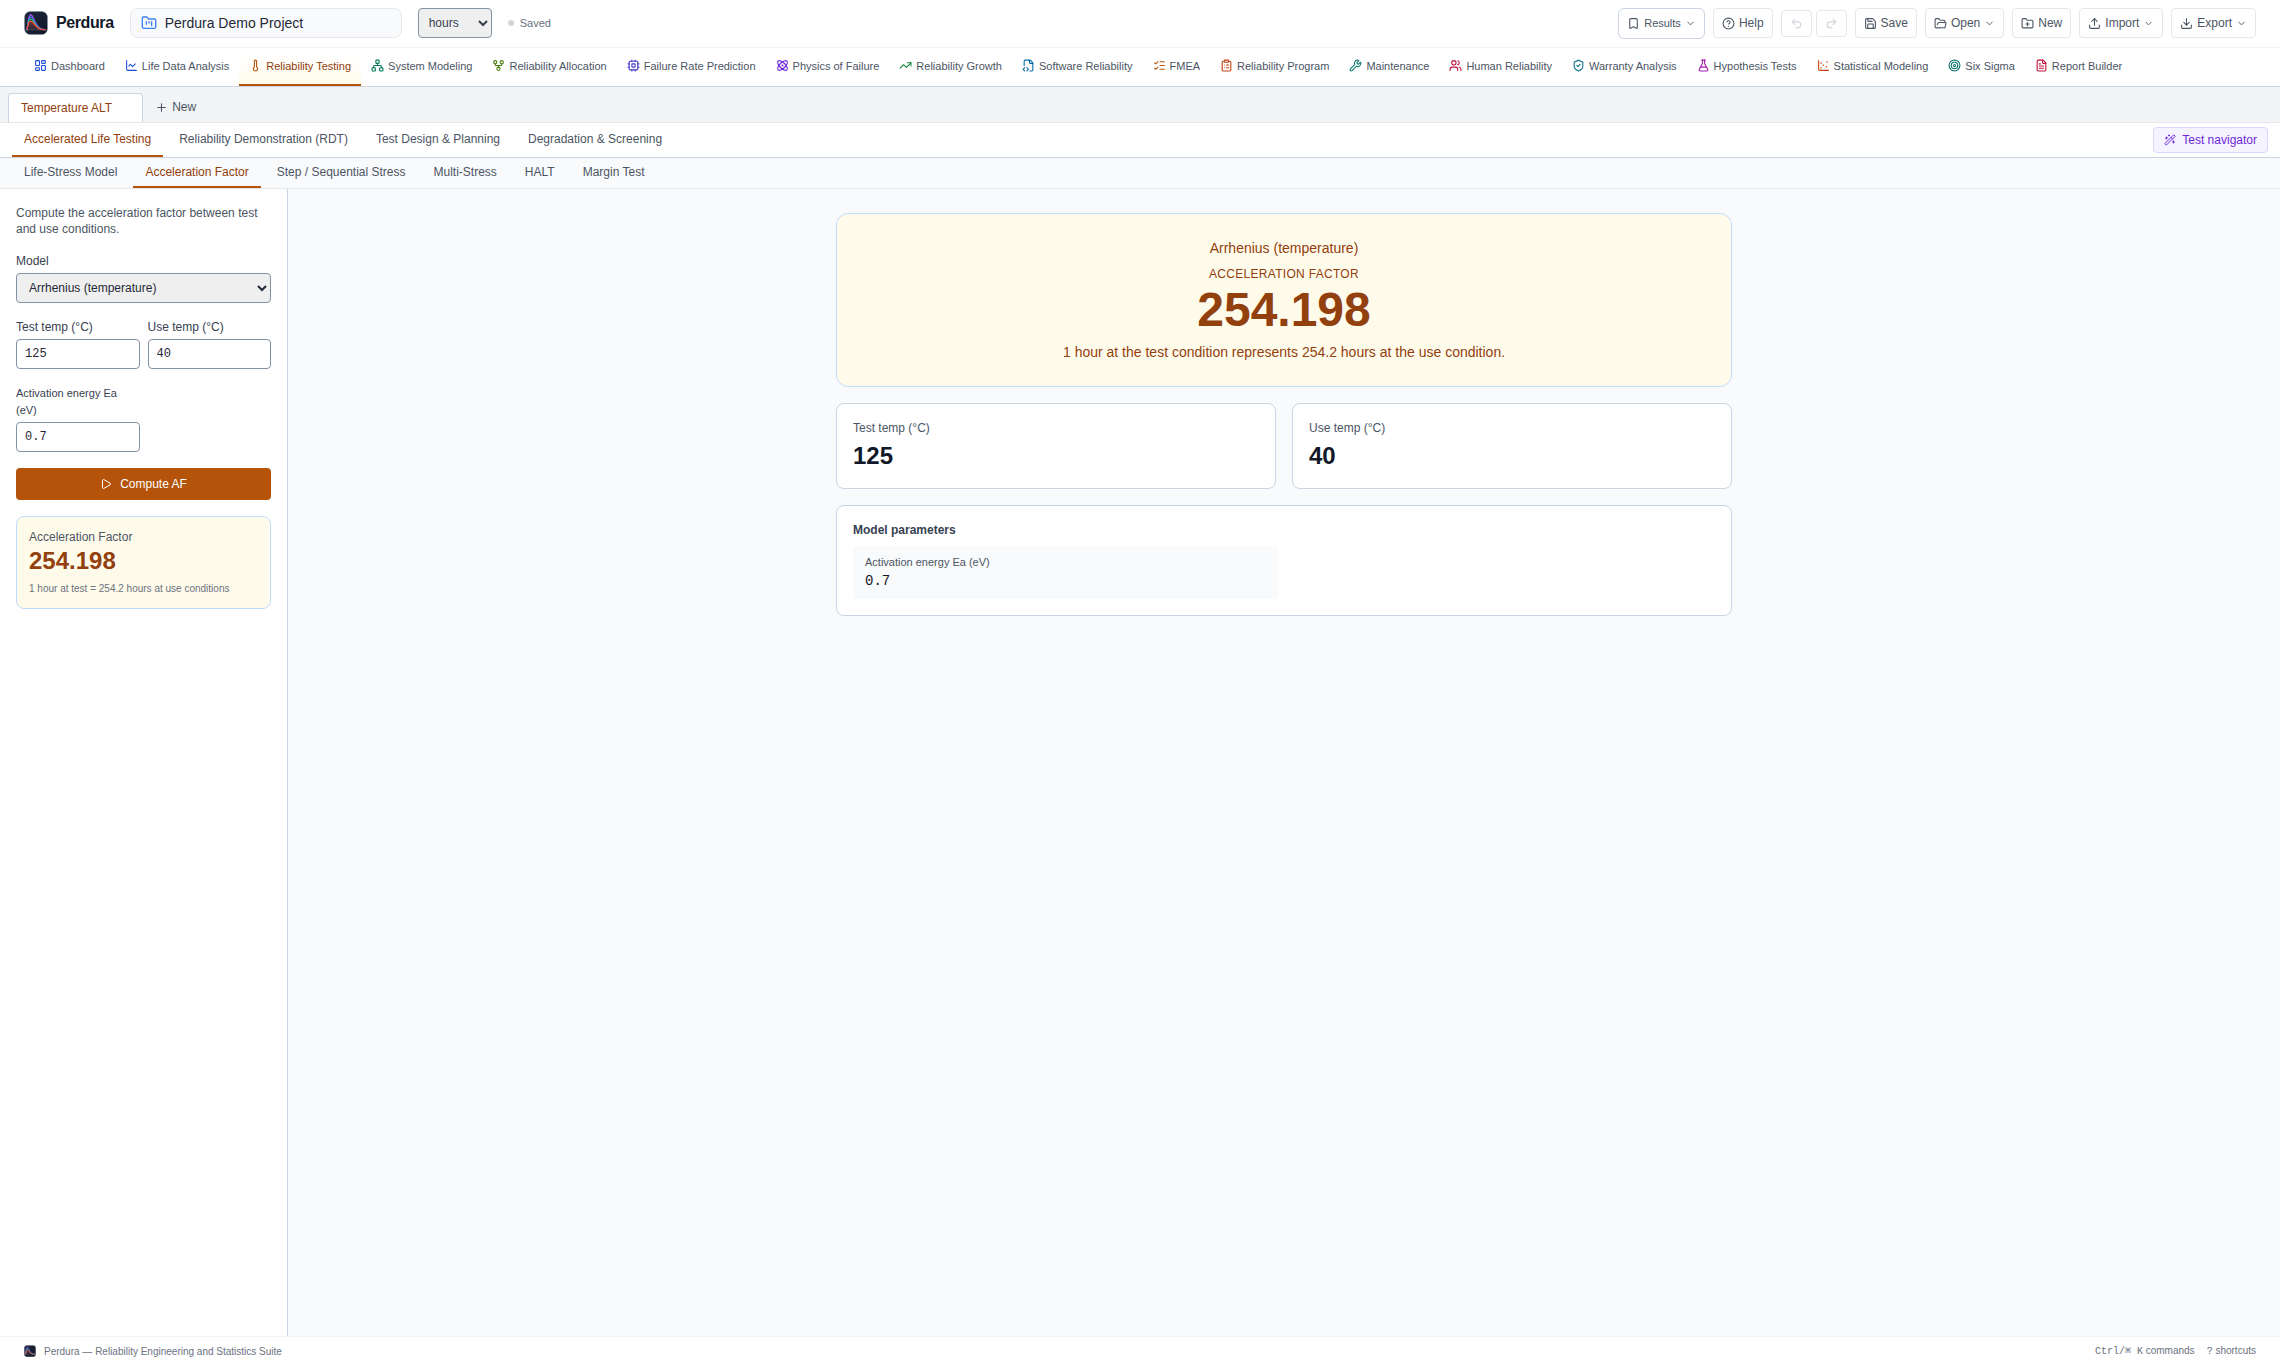
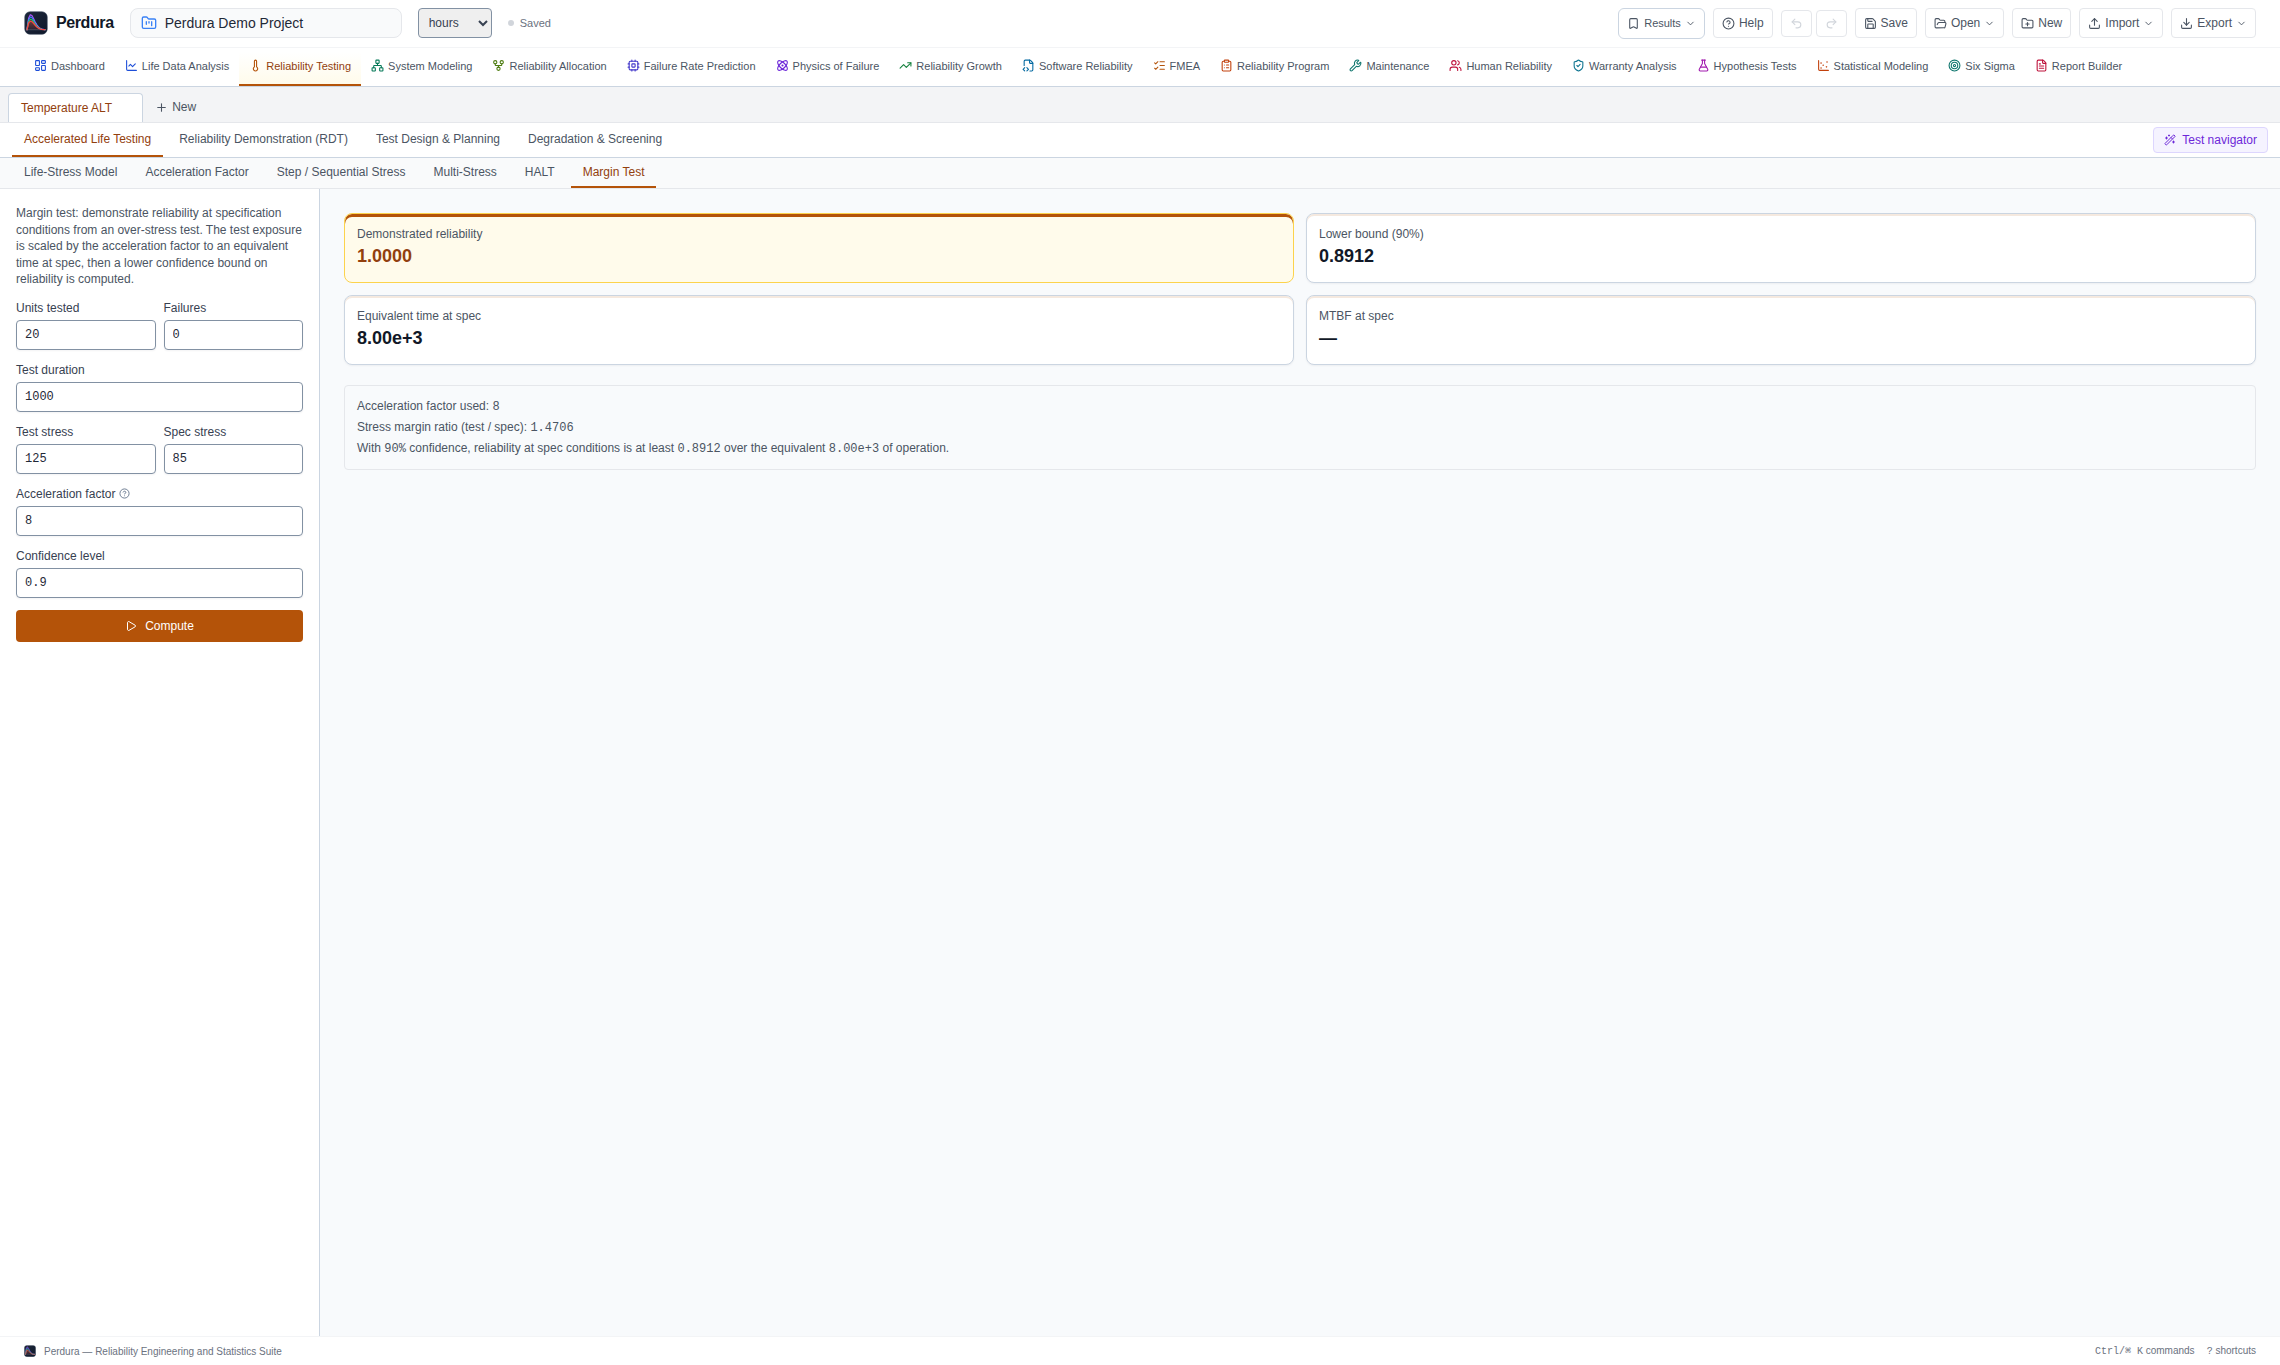
- Acceleration-factor calculations and interactive life–stress plots for conditions-of-use assessment
Failure Rate Prediction
Apply scoped part-stress, quality, environment and derating rules to estimate component and system failure rates.
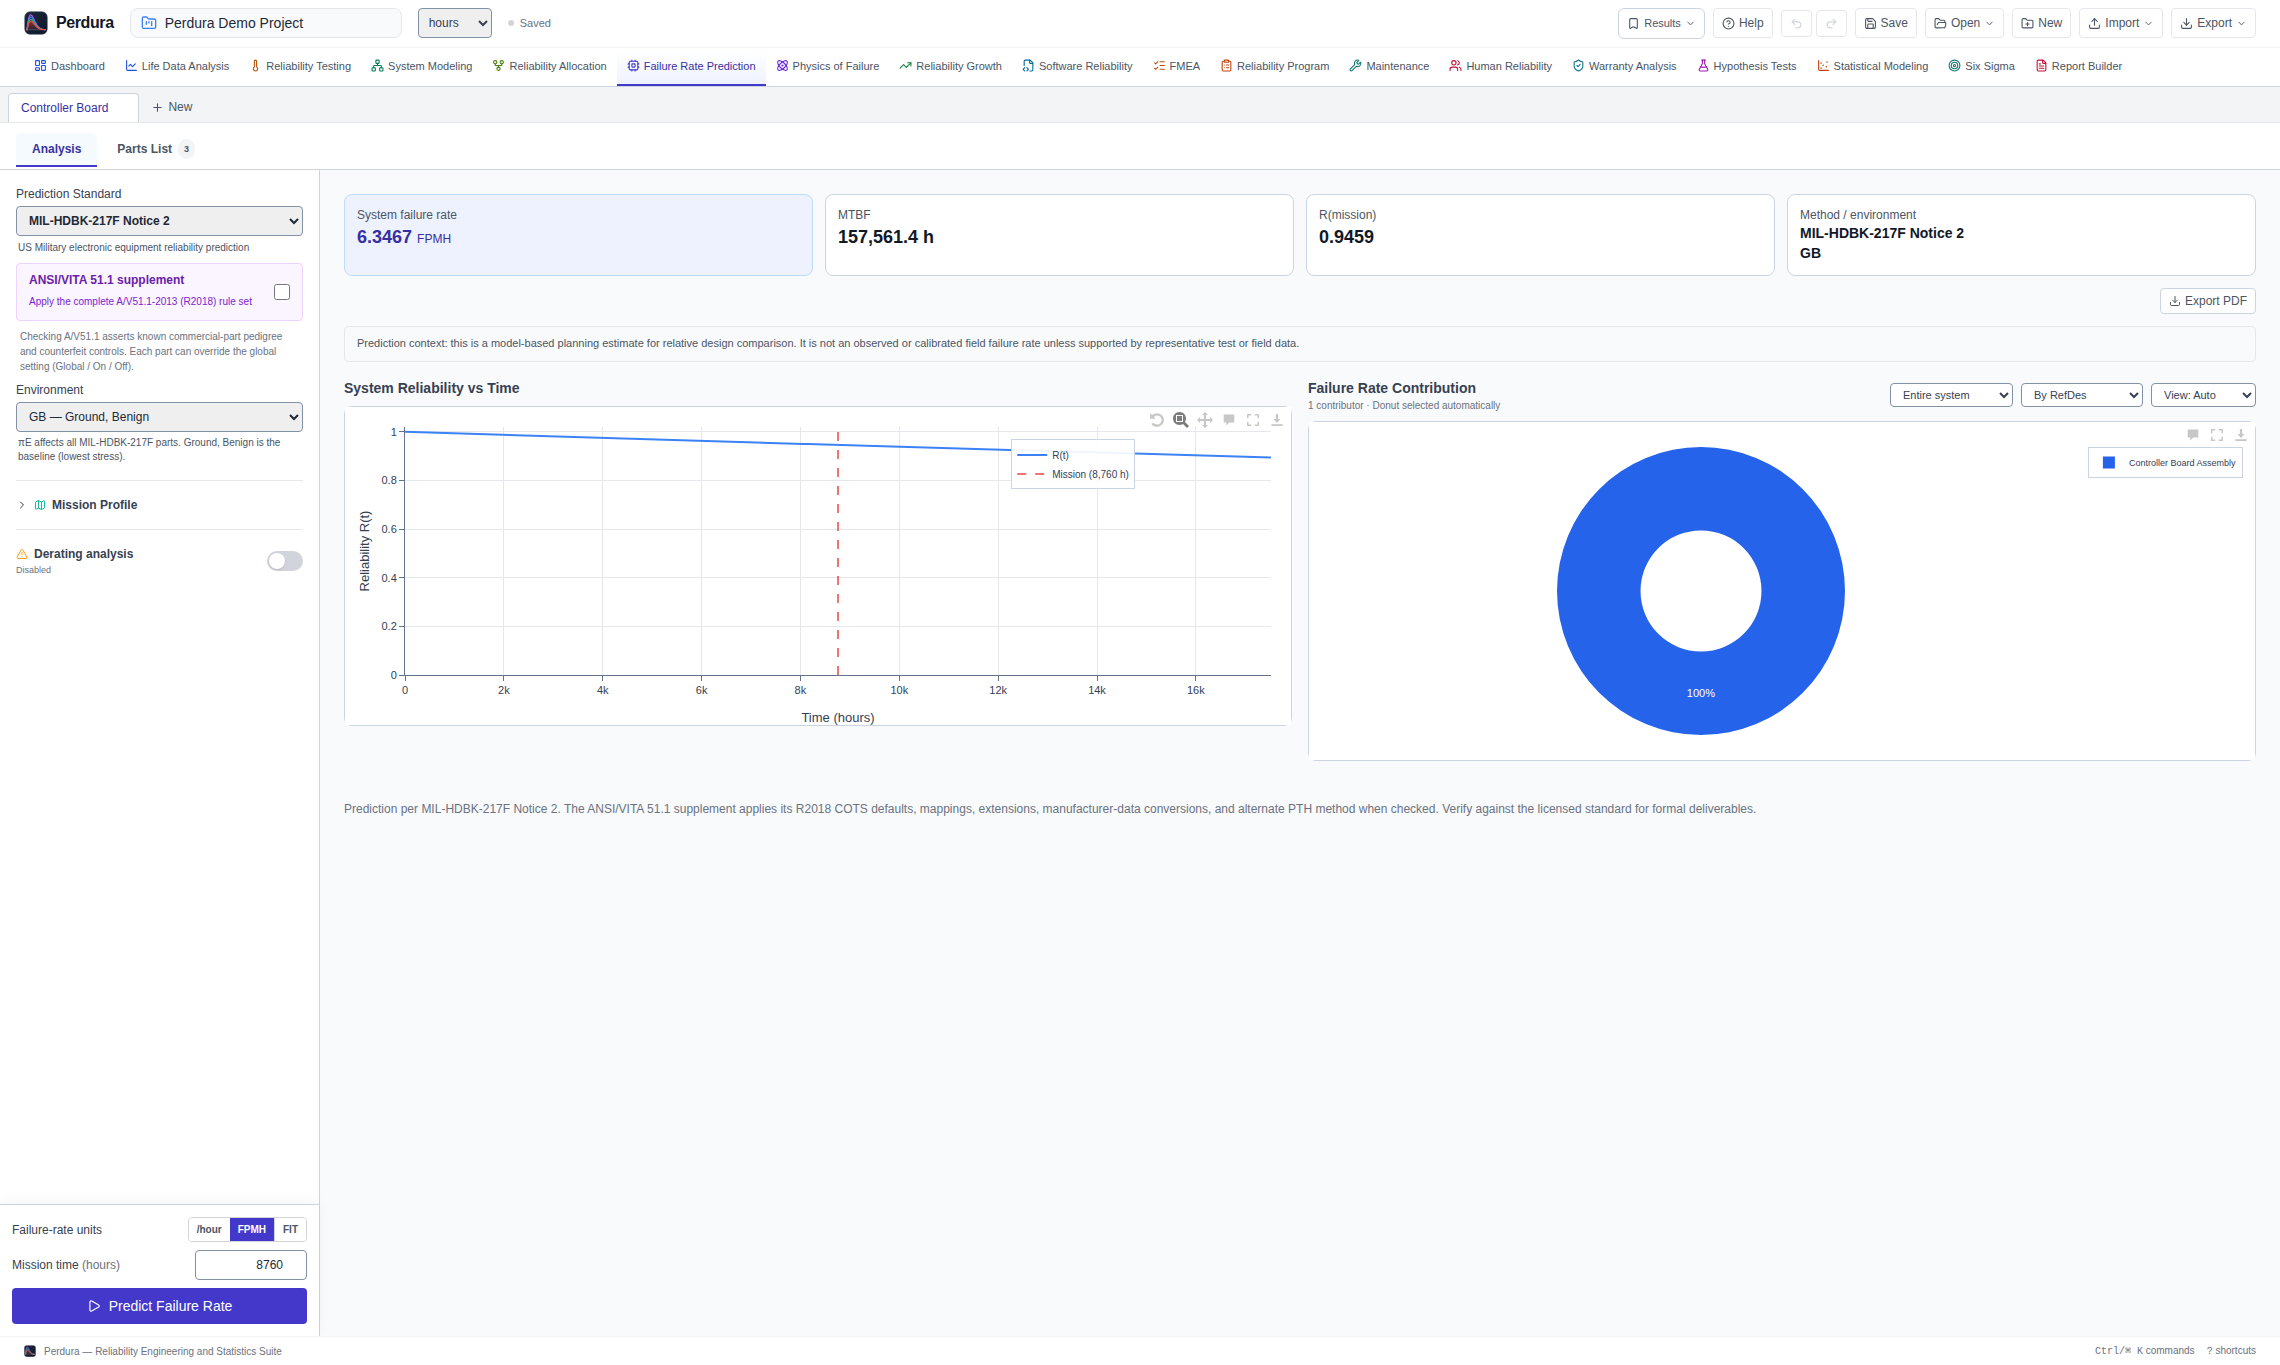
- MIL-HDBK-217F Notice 2 part-stress prediction with mapped equations and tables across the handbook’s numerical part categories
- Fourteen environments and applicable quality levels with visible π-factor contributions, source disclosures and overrides
- ANSI/VITA 51.1 COTS adjustments, RADC nonoperating models and source-specific component-derating assessments
- Custom and generic parts for user-defined or field-derived failure-rate models
- System rollup of λ (FPMH), MTBF and mission R(t), with nested blocks and failure-rate contribution
System Reliability (RBD)
Model system configurations and quantify reliability, path sets and component importance.
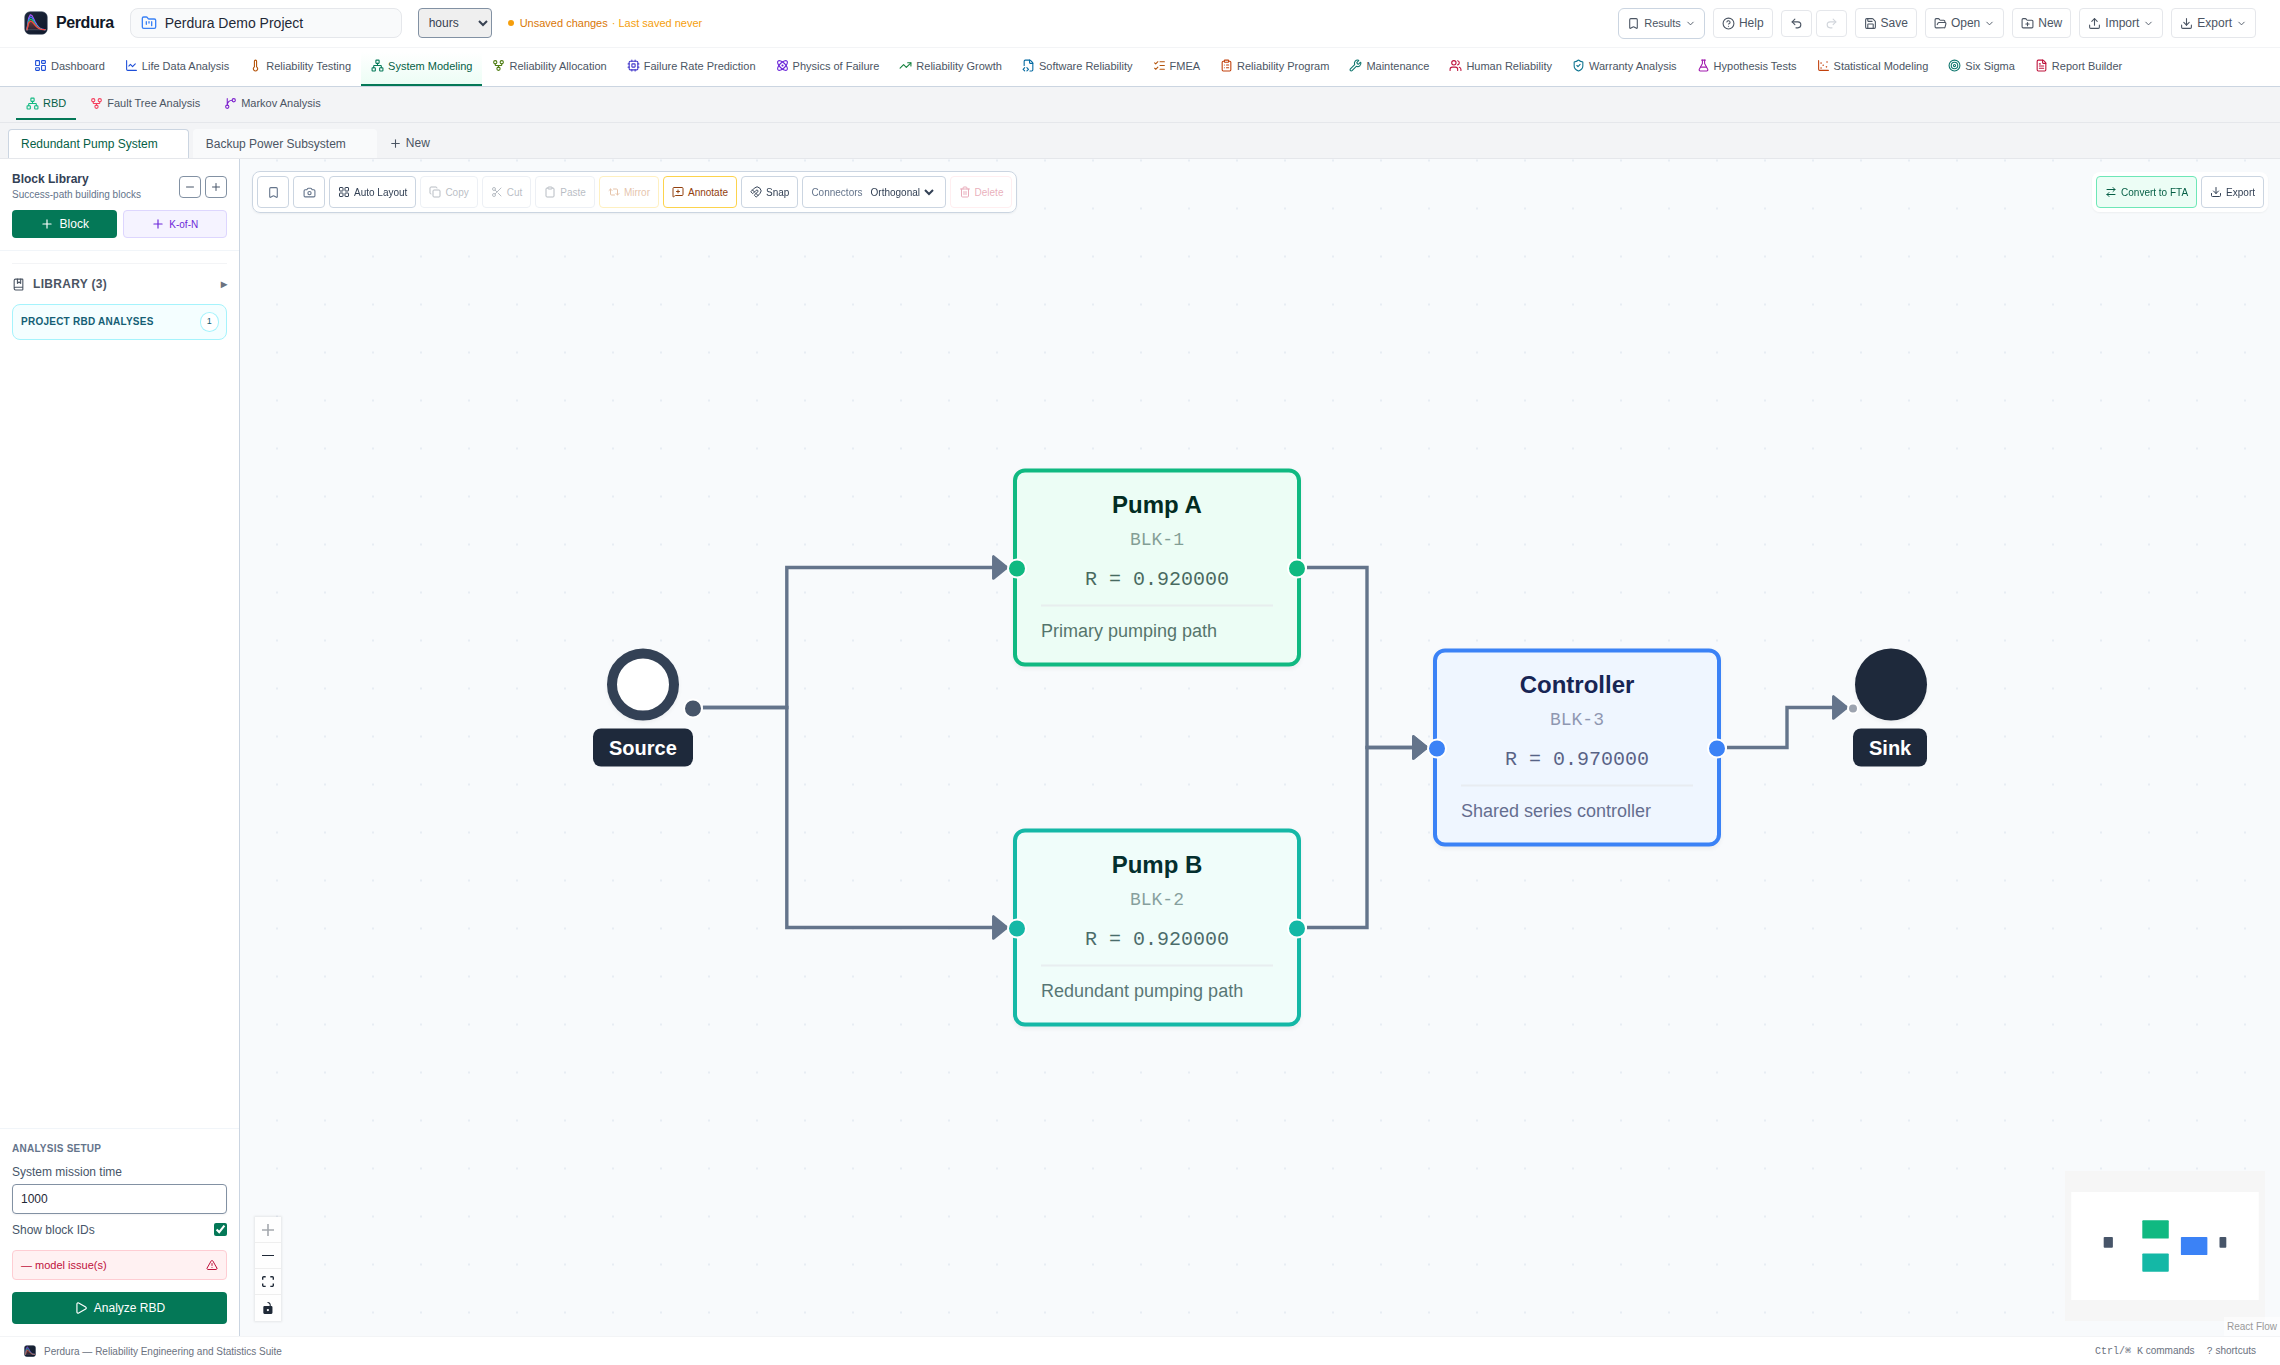
- Series, parallel, k-out-of-n and network configurations on a drag-and-drop canvas
- Nested subsystem models with automatic layout
- System reliability and minimal path-set evaluation
- Birnbaum, Criticality, RAW and RRW importance measures
Fault Tree Analysis (FTA)
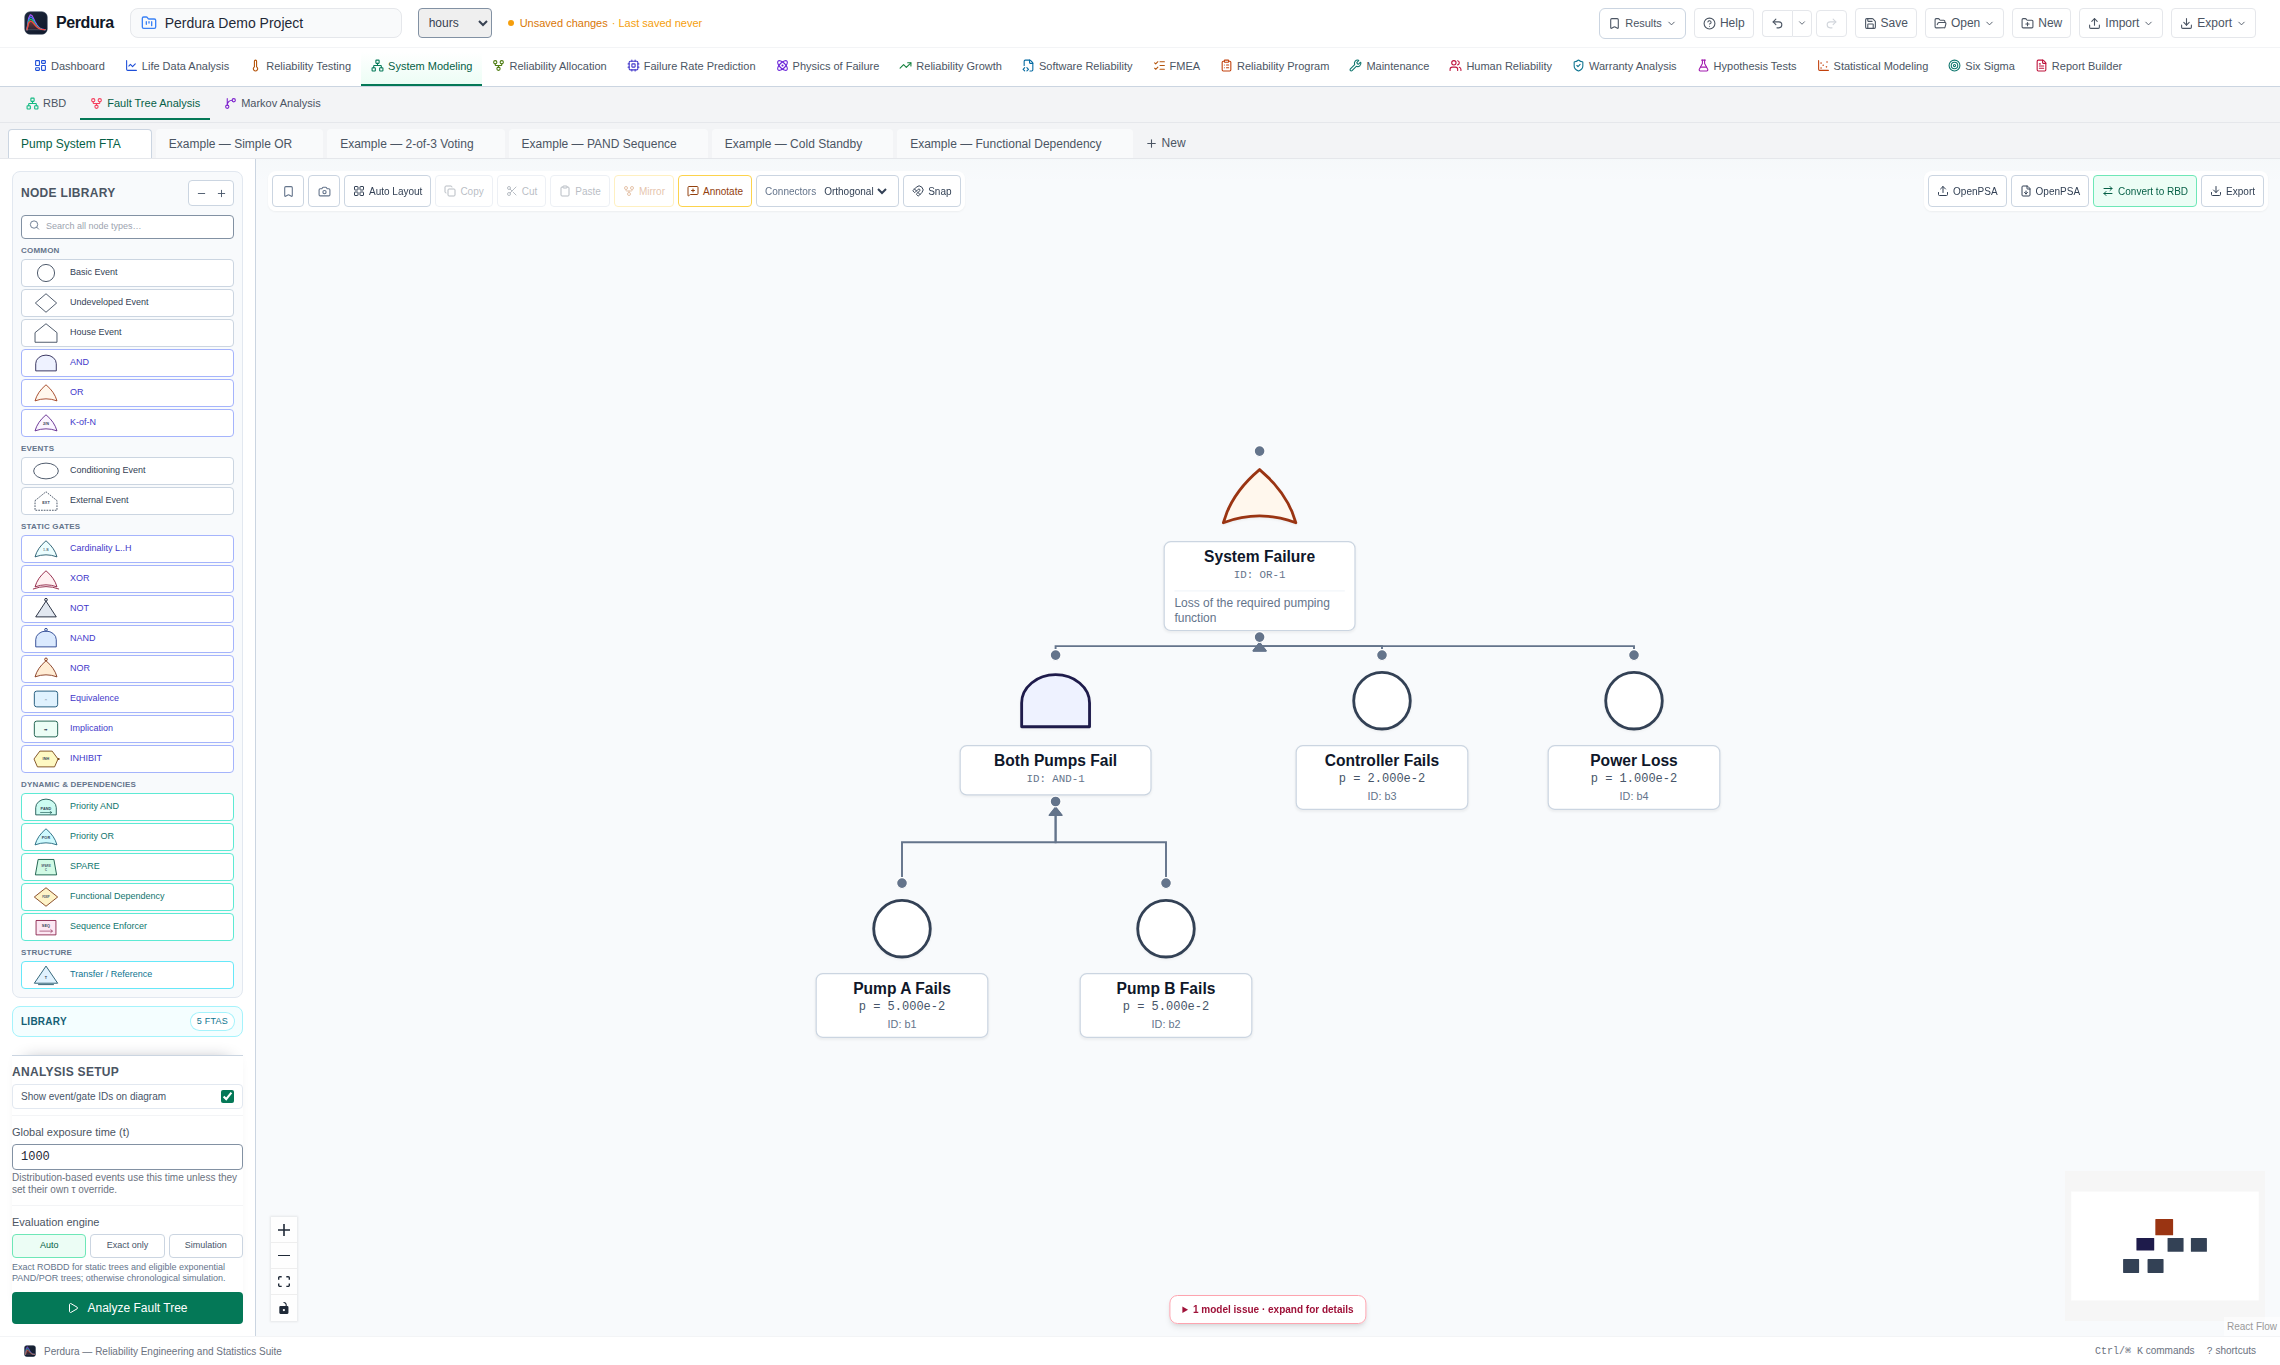
Evaluate top-event risk, minimal cut sets and contributor importance with fault trees.
- Drag-and-drop gates: AND, OR, VOTE (k-of-n), PAND, XOR, NOT and Transfer
- Quantitative top-event probability evaluation
- MOCUS minimal cut sets with diagram highlighting for failure-path review
- Birnbaum, Fussell–Vesely, RAW and RRW importance measures
Reliability Growth & Repairable Systems
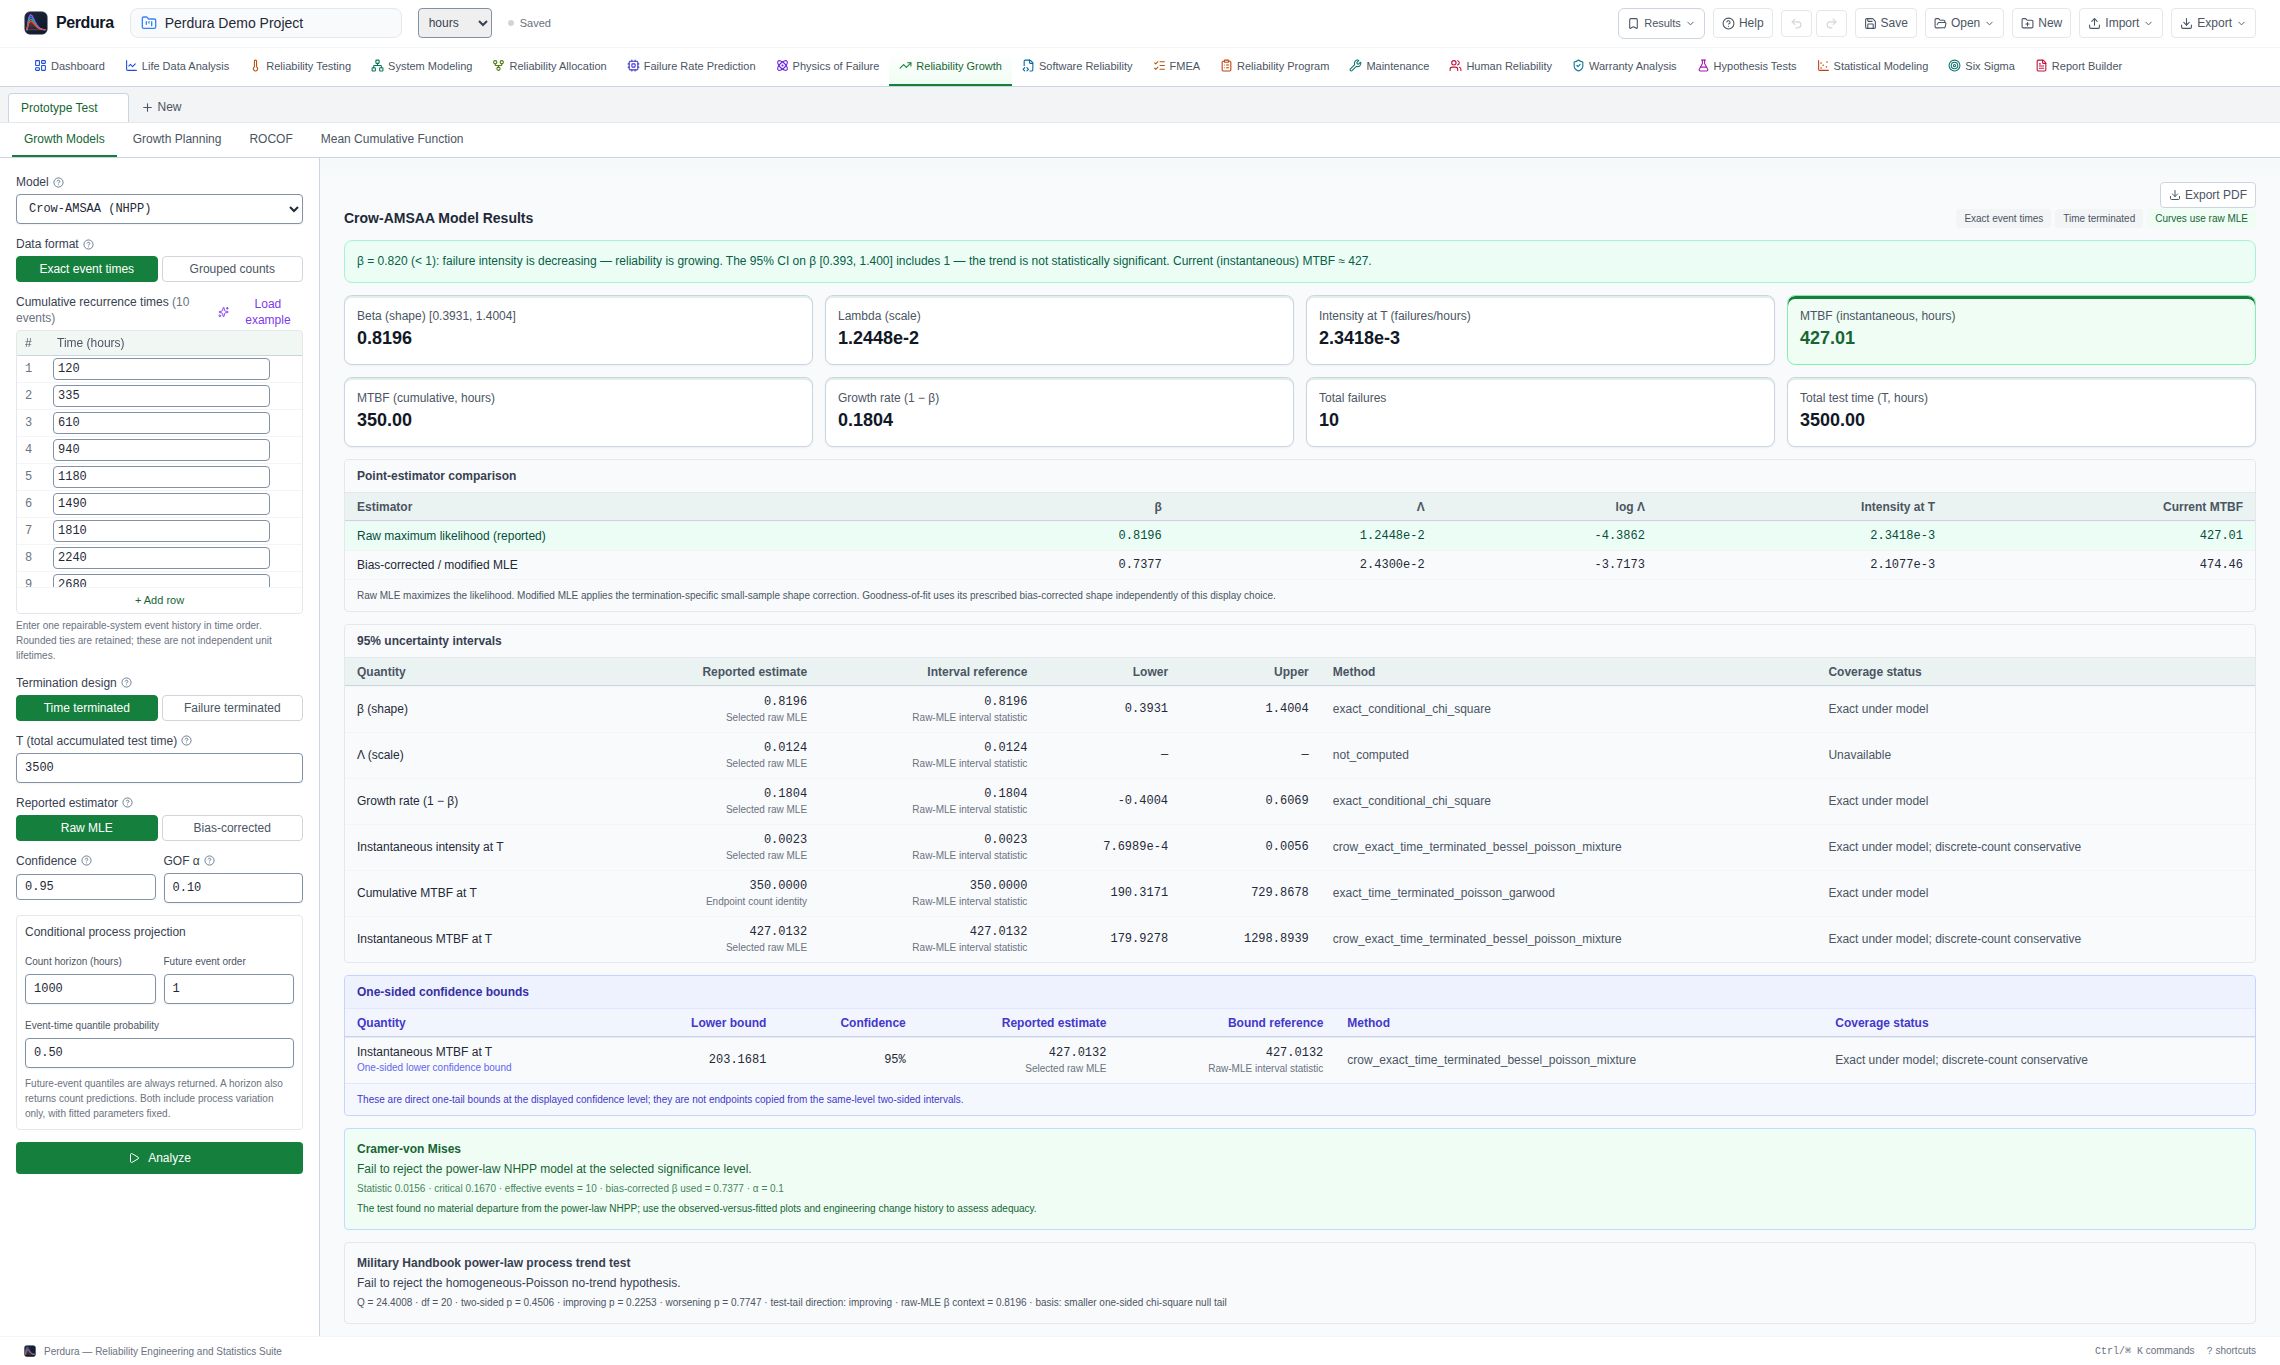
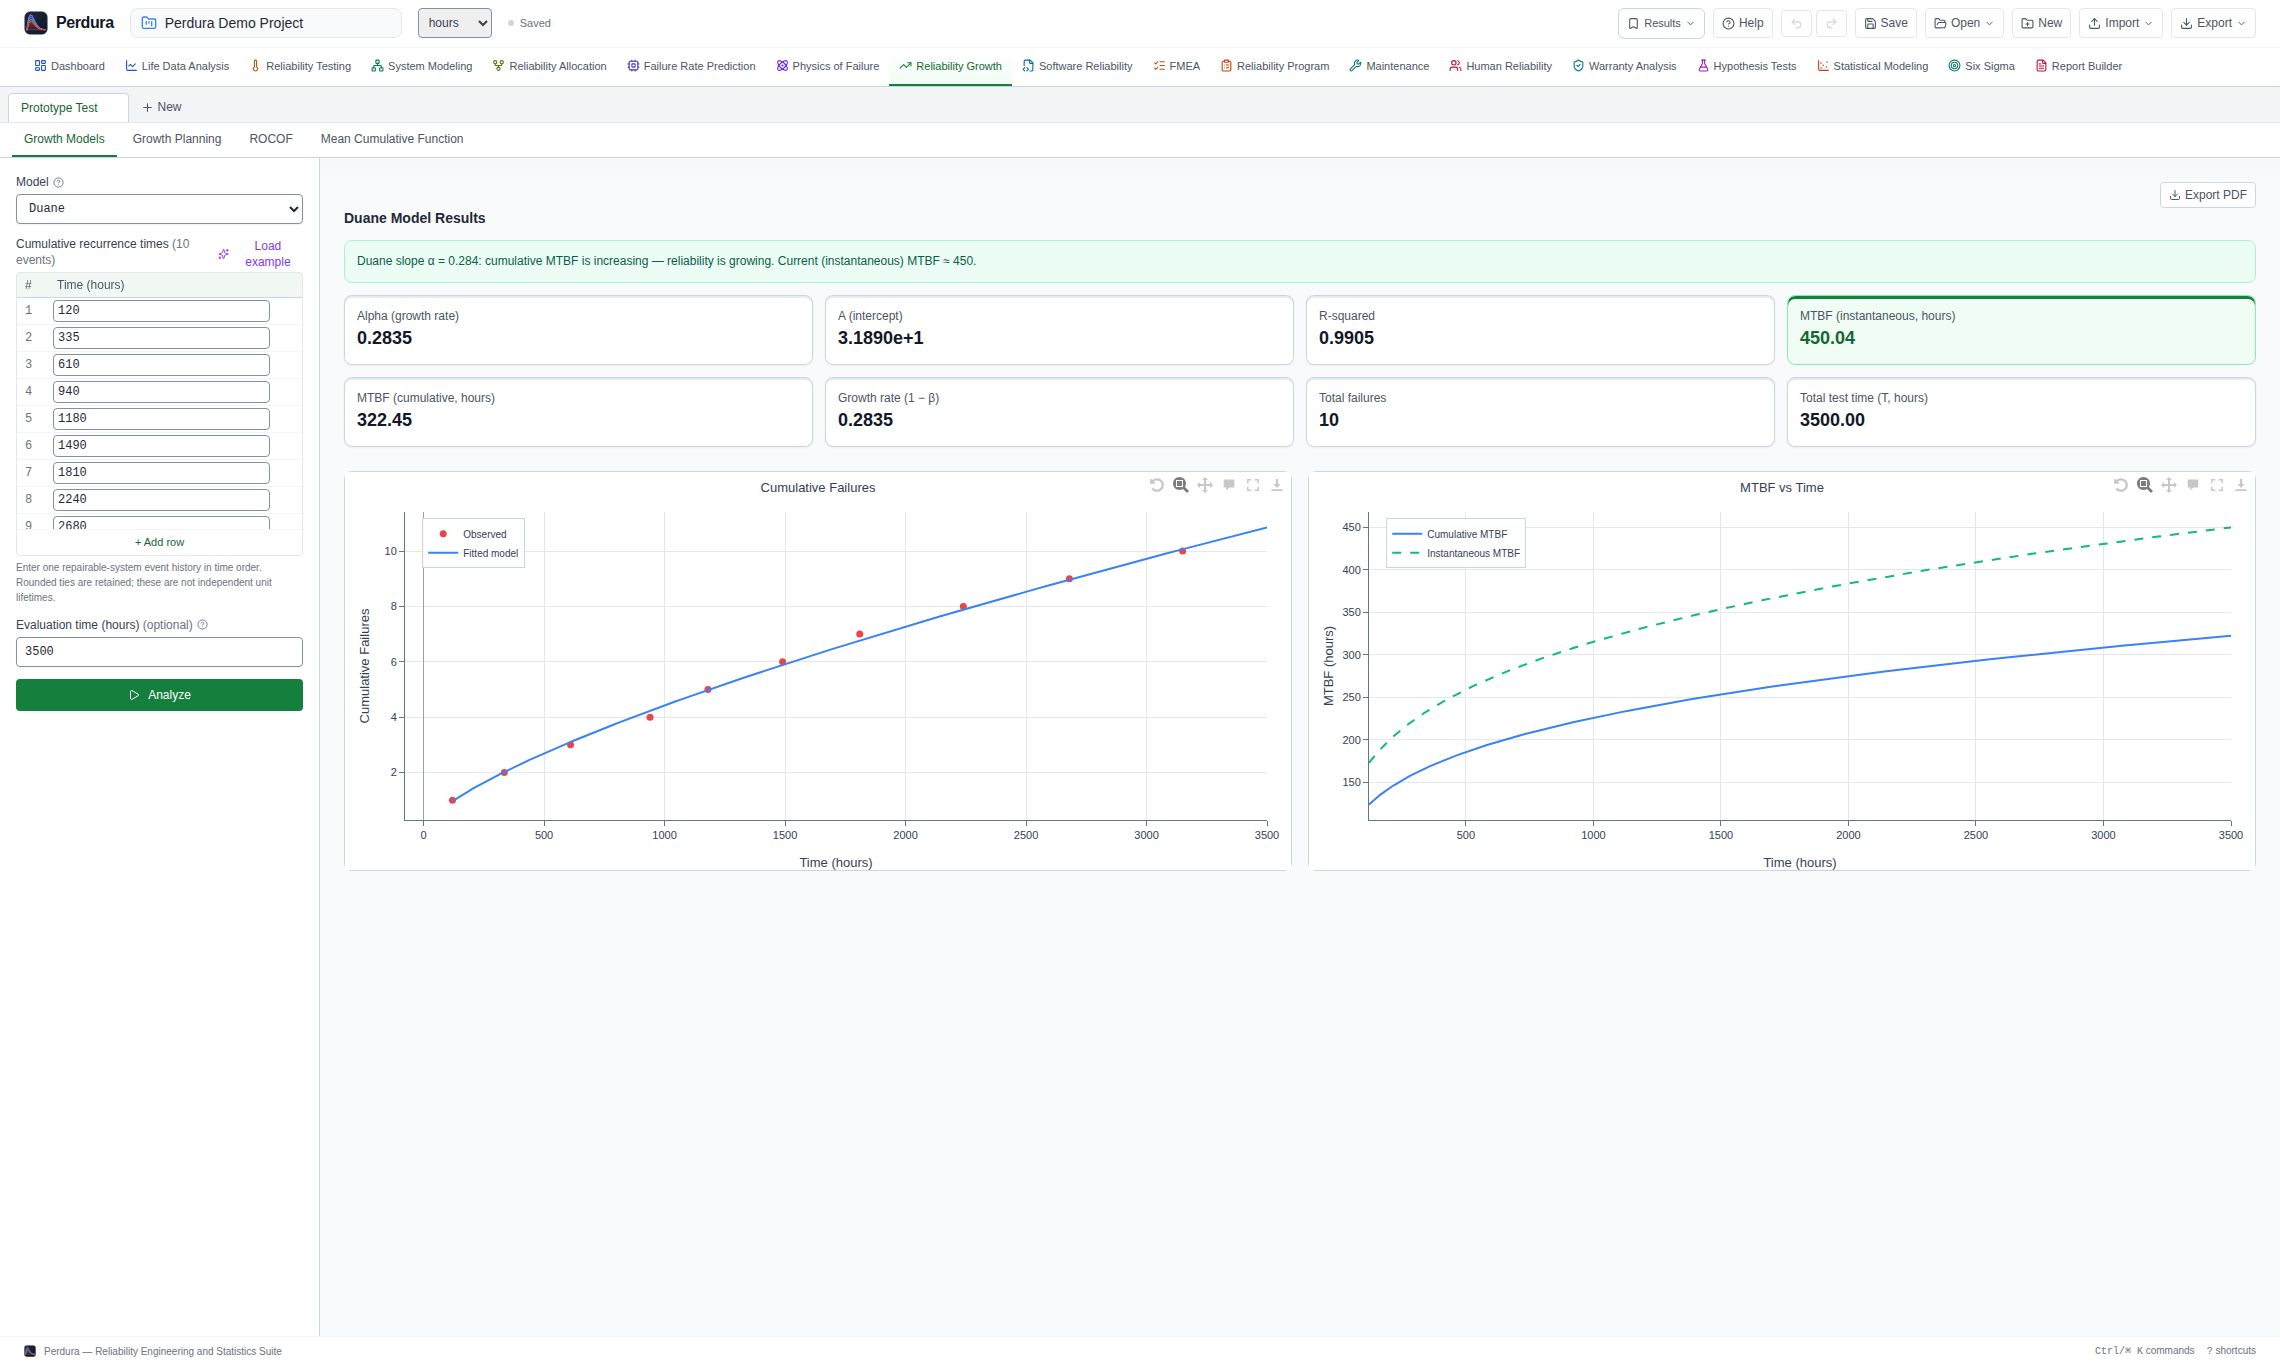
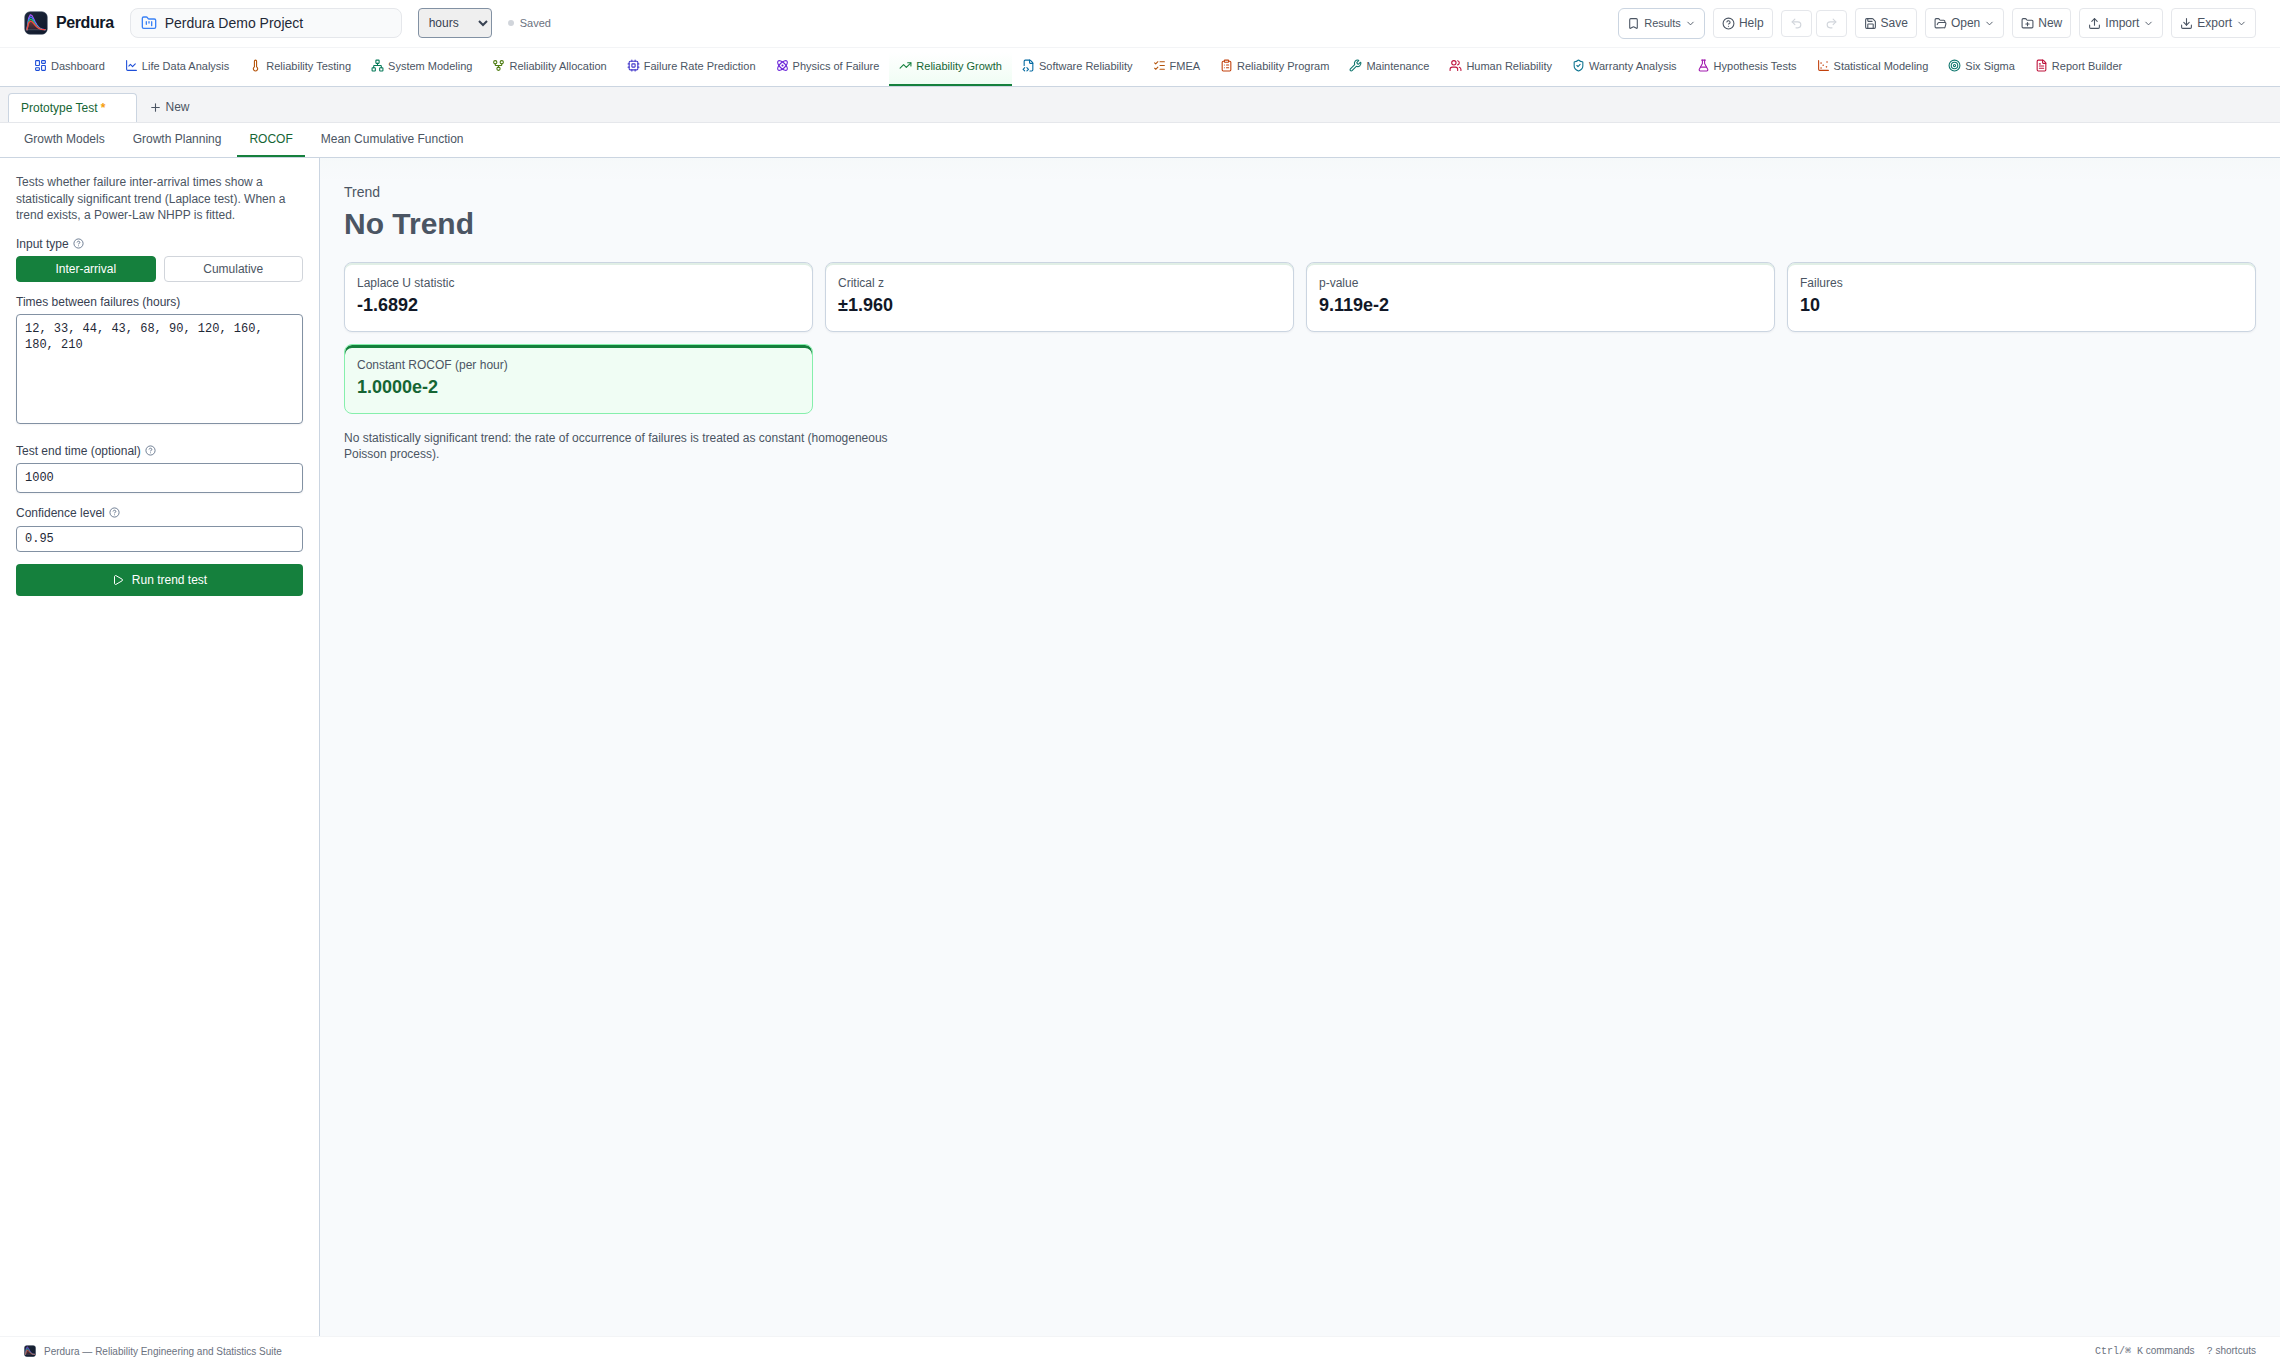
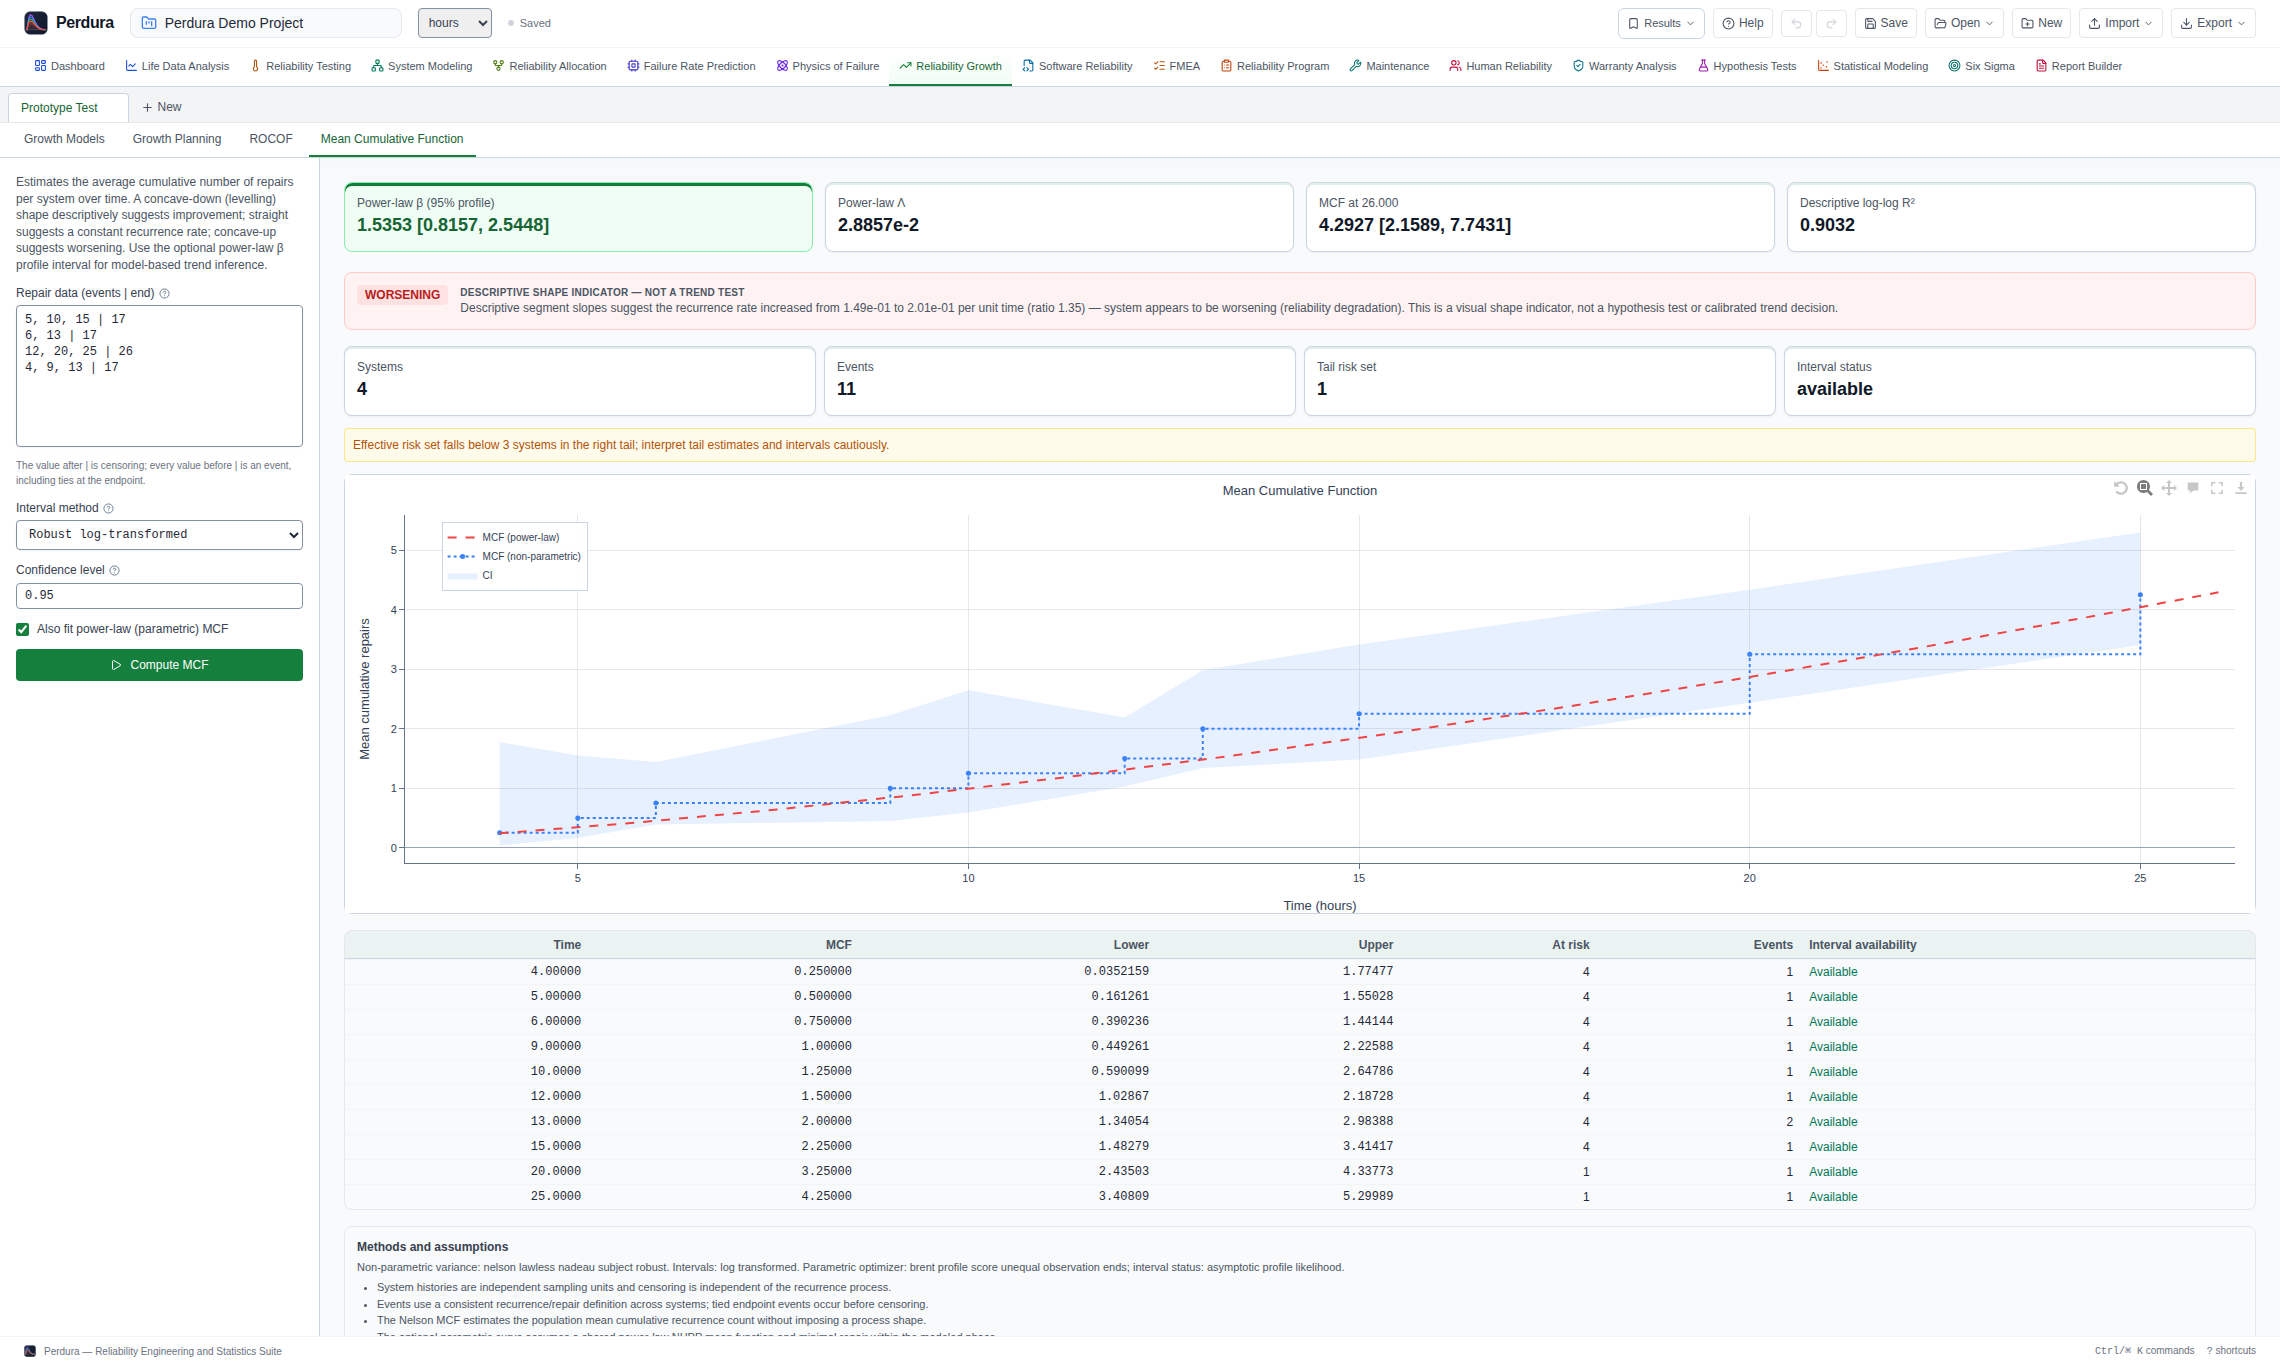
Assess reliability growth and repairable-system trends with Crow–AMSAA, Duane, ROCOF and MCF.
- Crow-AMSAA (NHPP power law) with MLE estimation and the Duane graphical method
- Growth rate, cumulative and instantaneous MTBF, and Cramér–von Mises goodness of fit
- Failure-terminated and time-terminated reliability-growth data
- Repairable-system analysis with ROCOF/Laplace trend tests and mean cumulative function (MCF)
Maintenance Planning & Availability
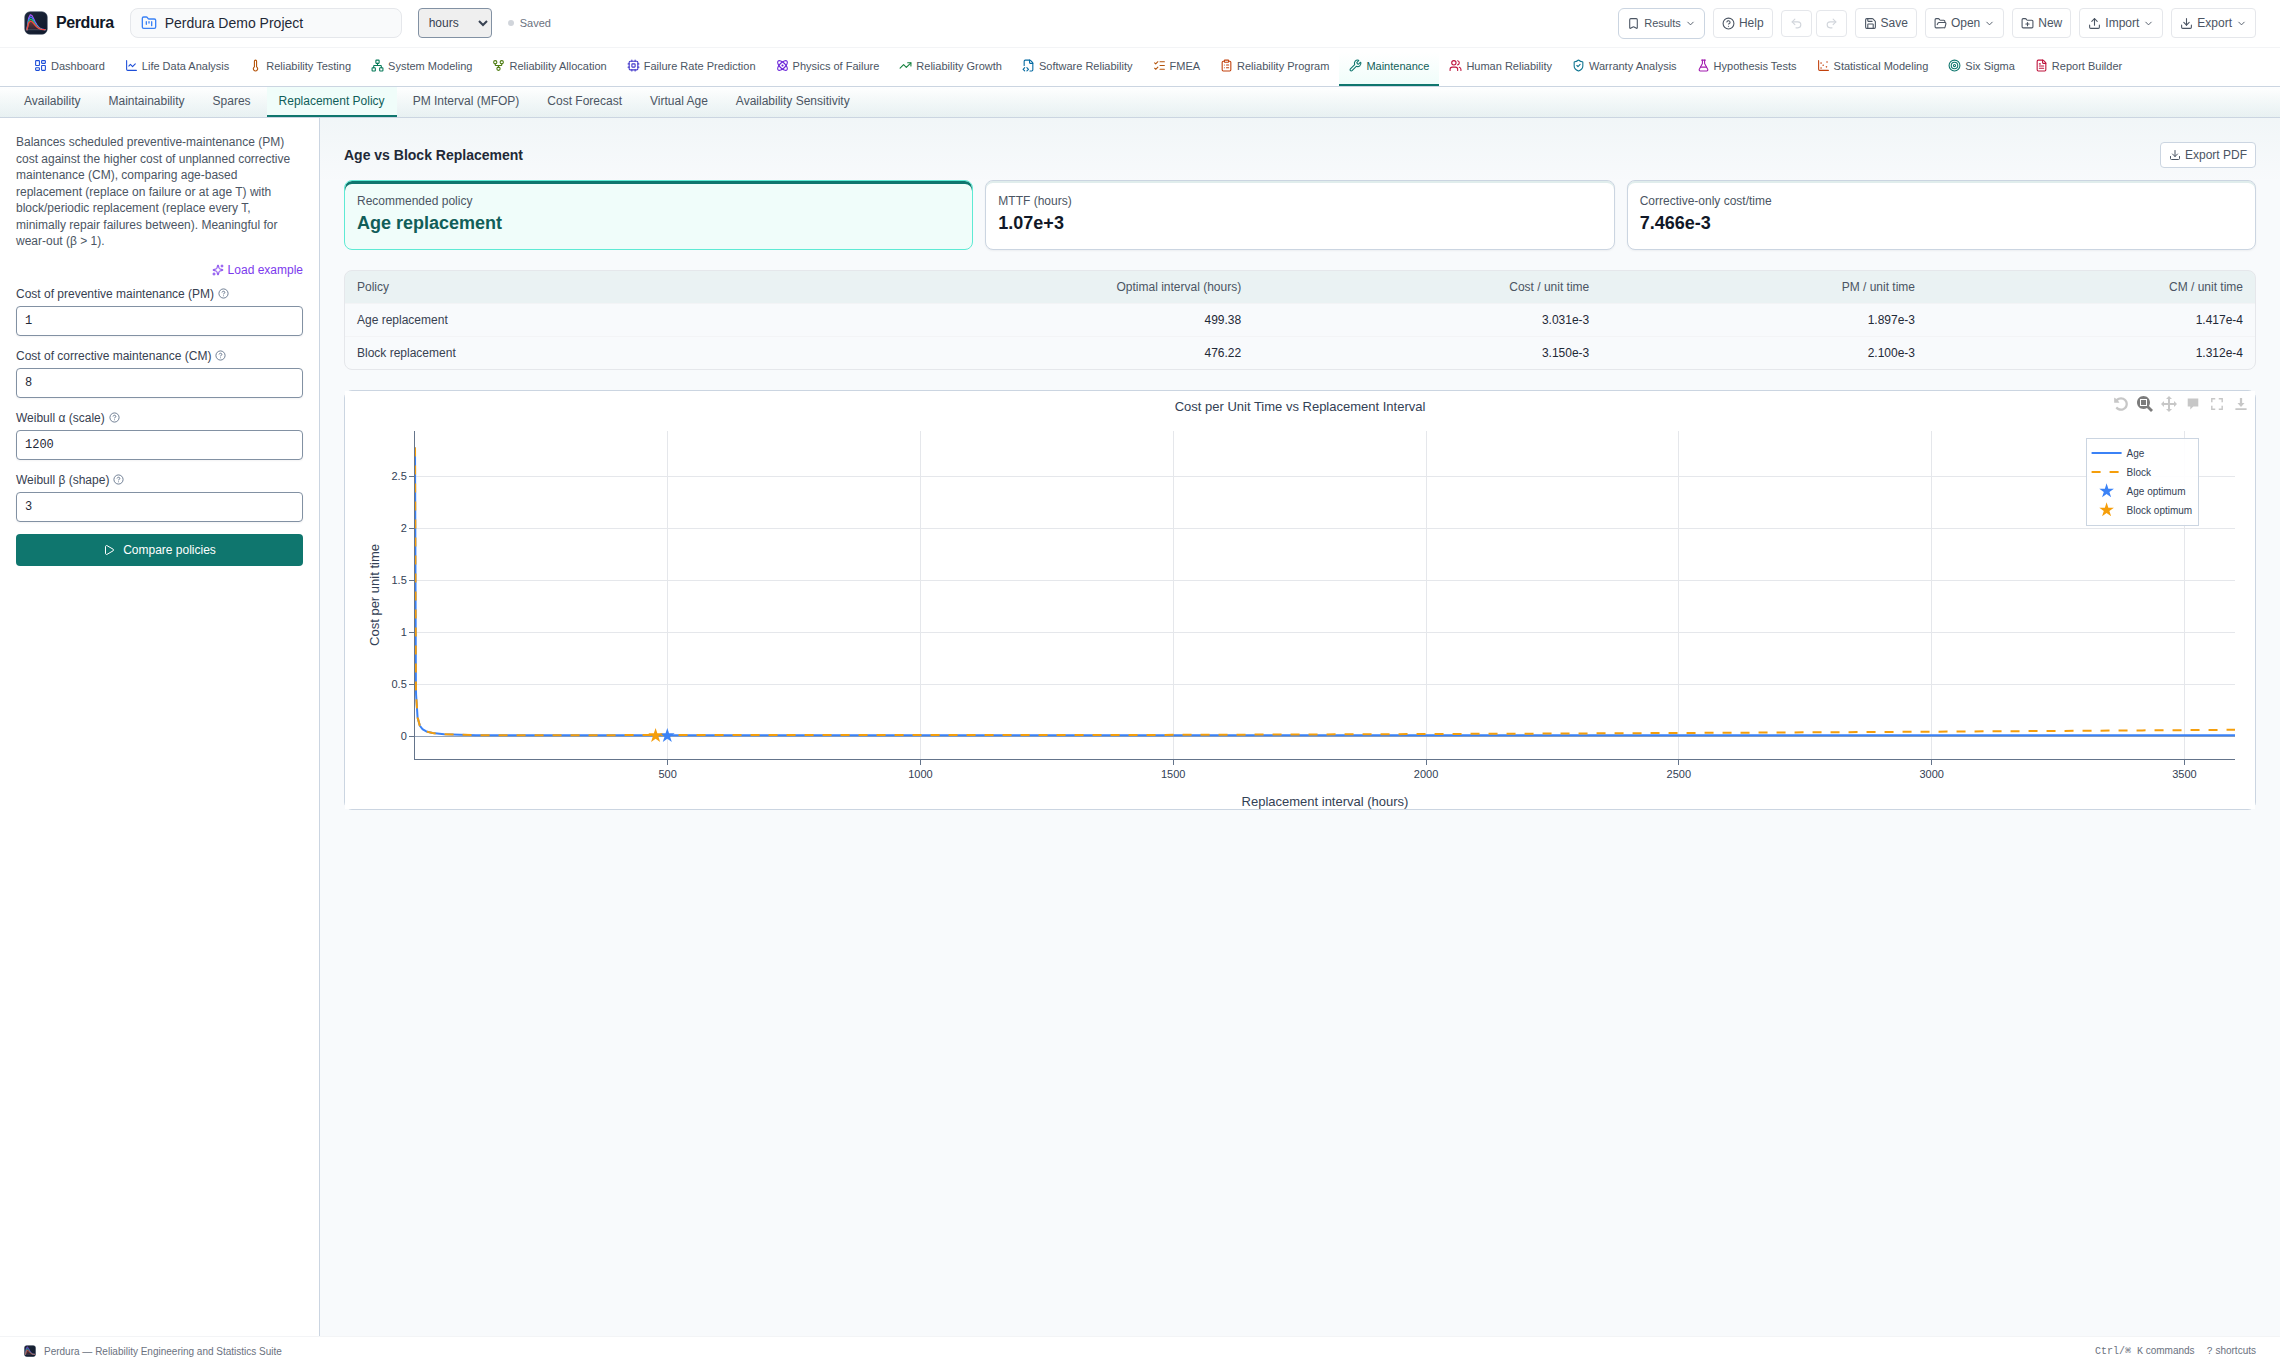
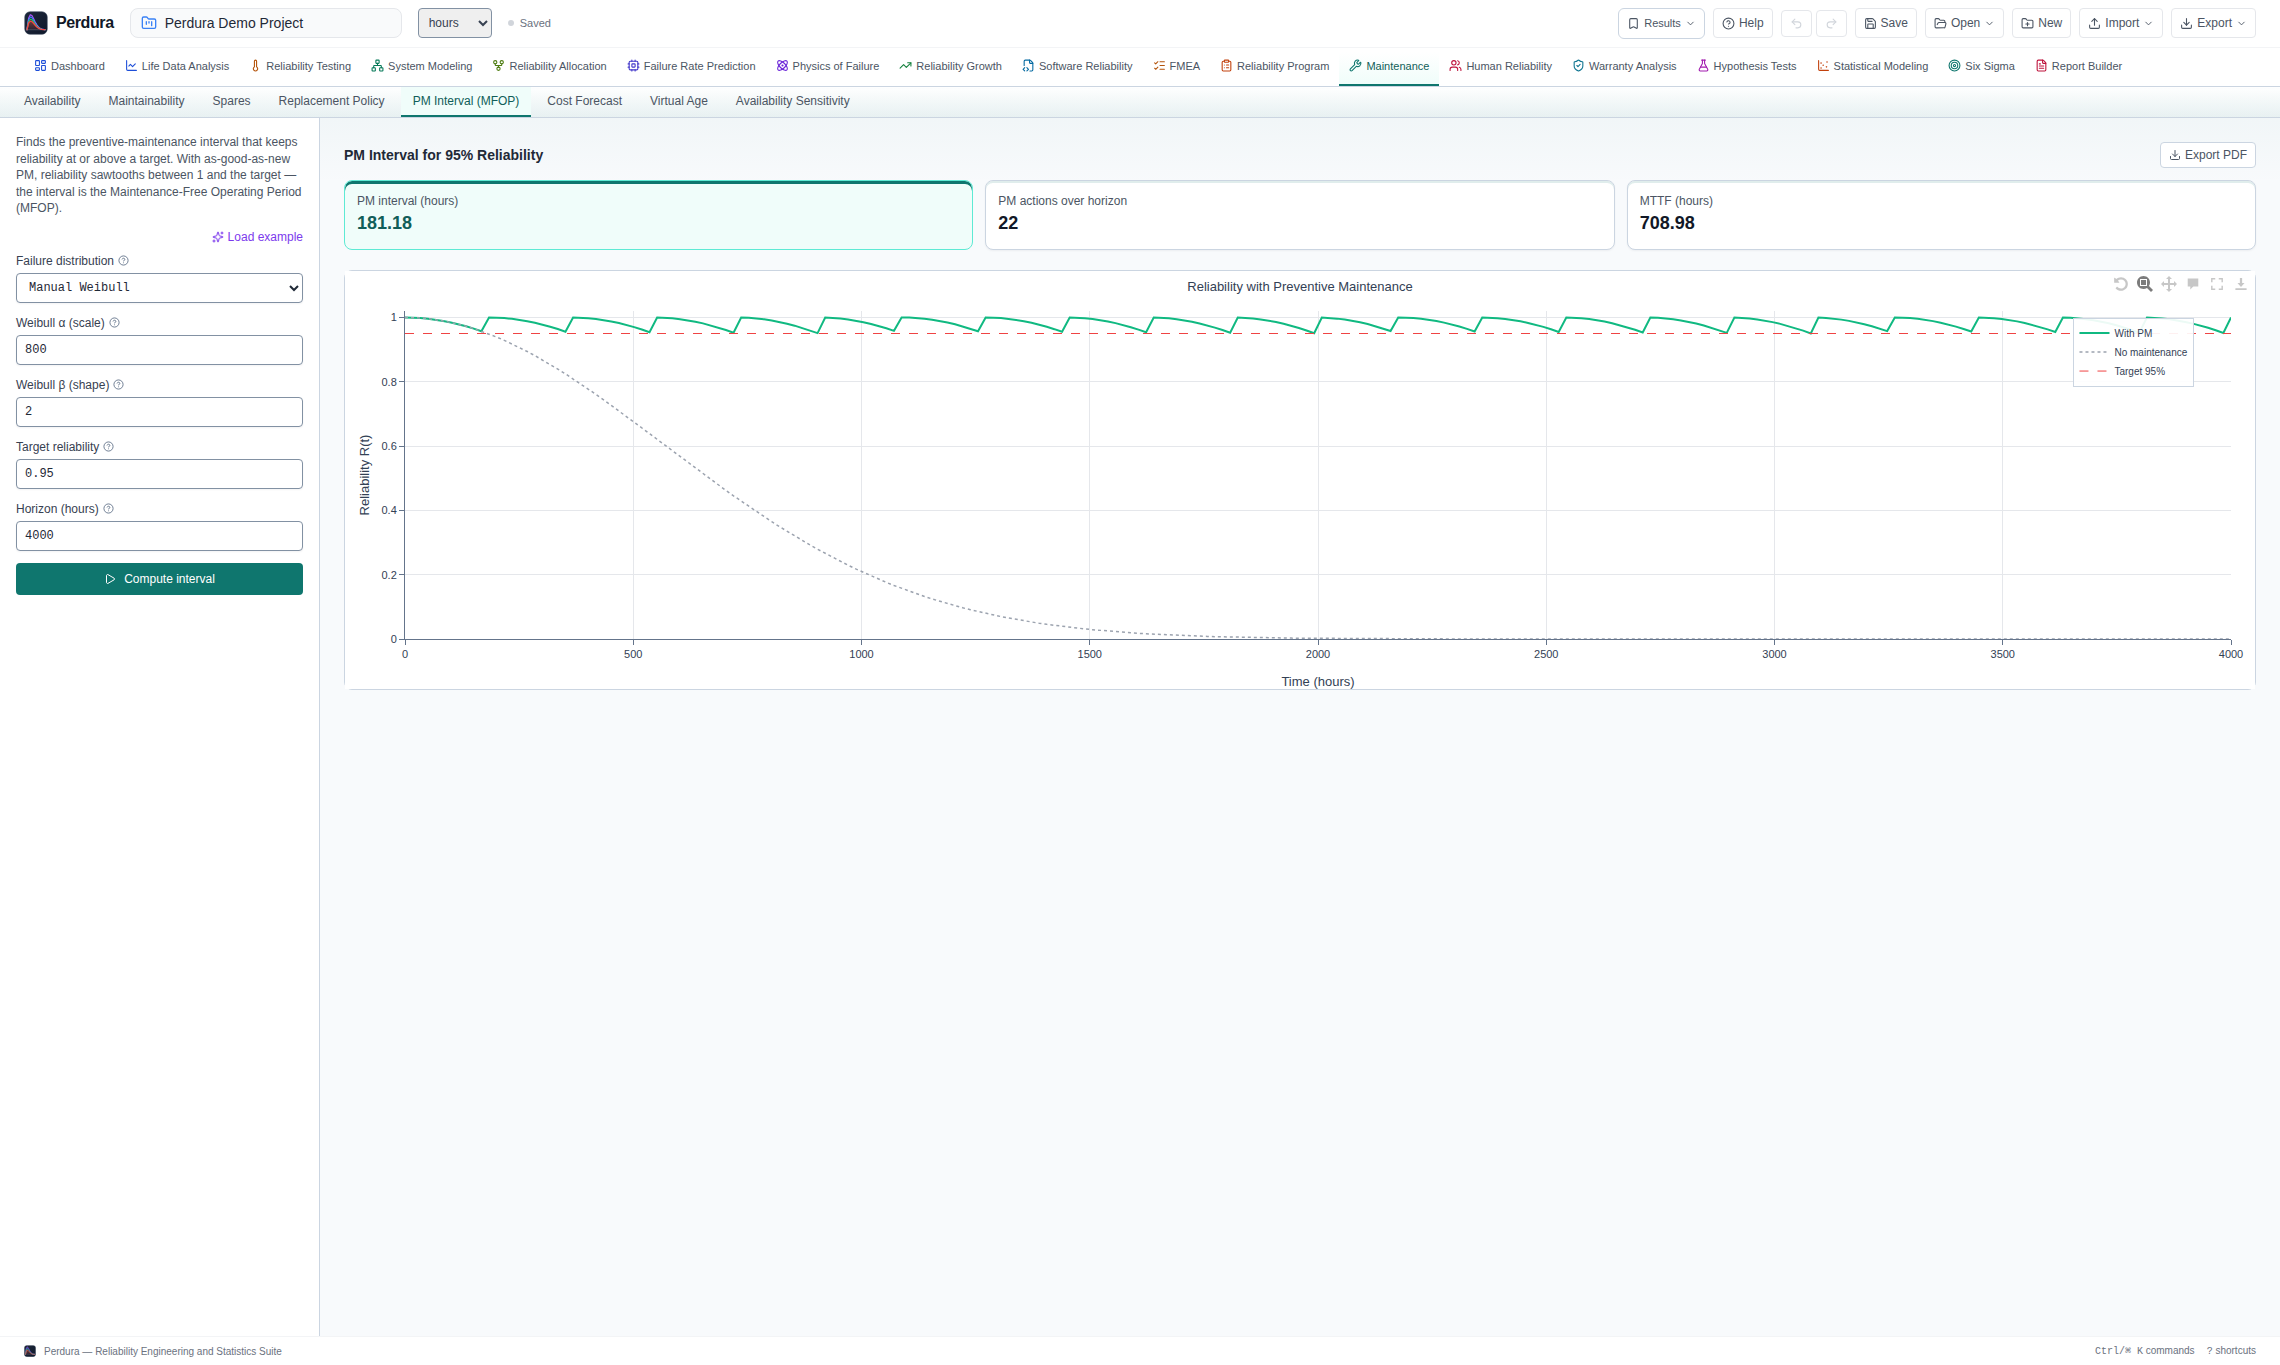
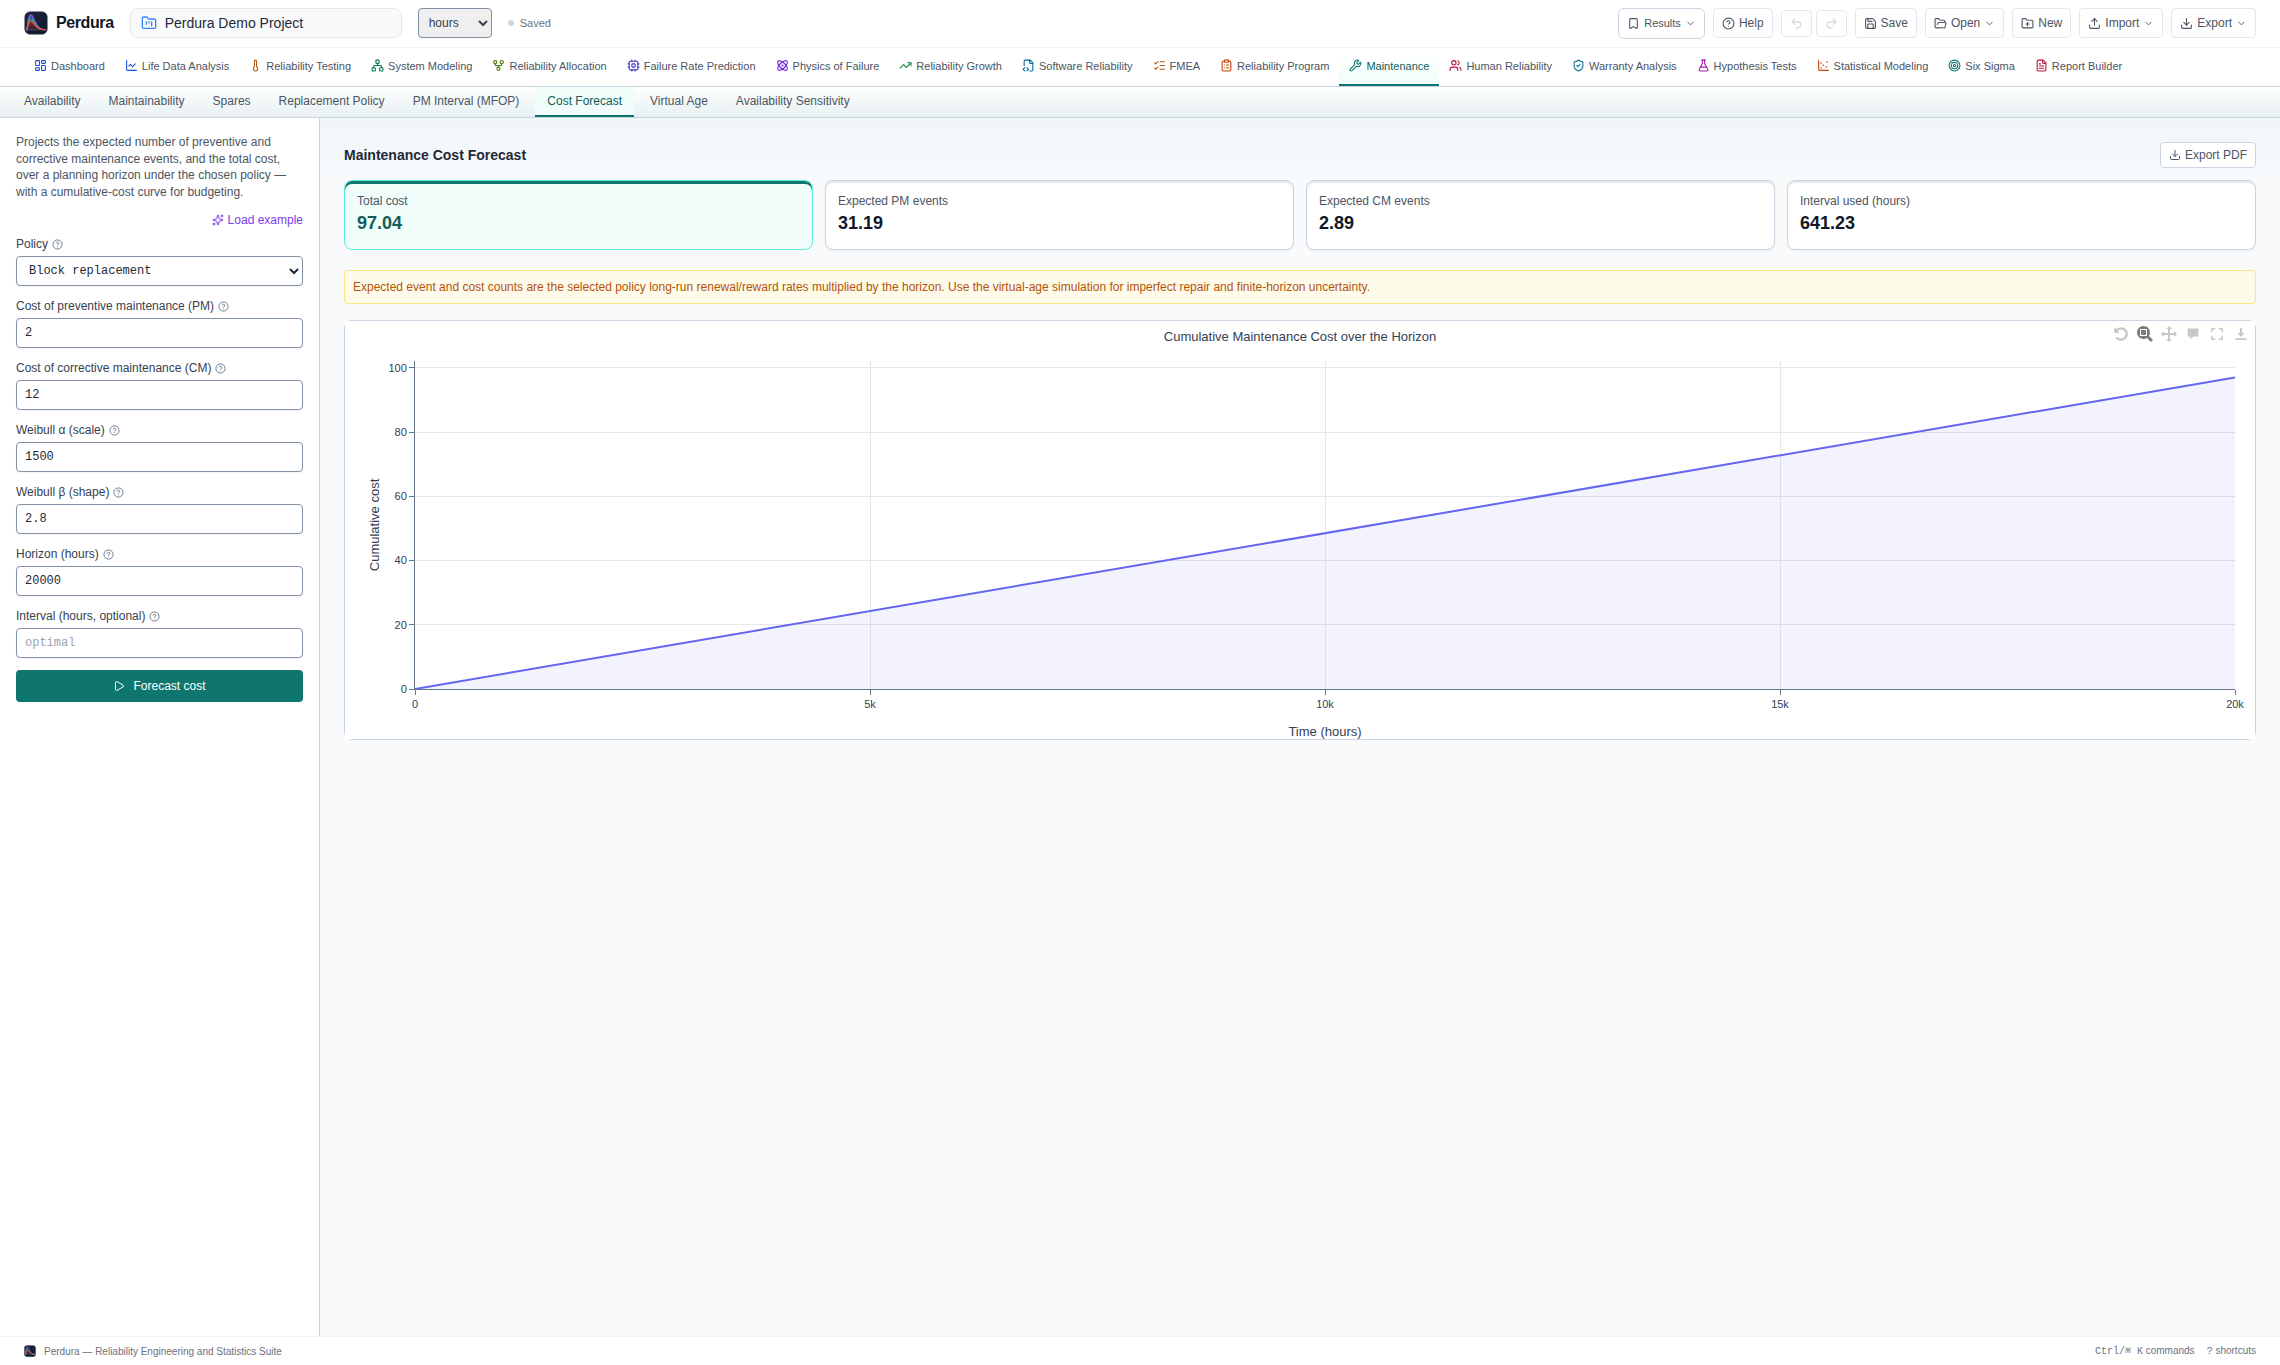
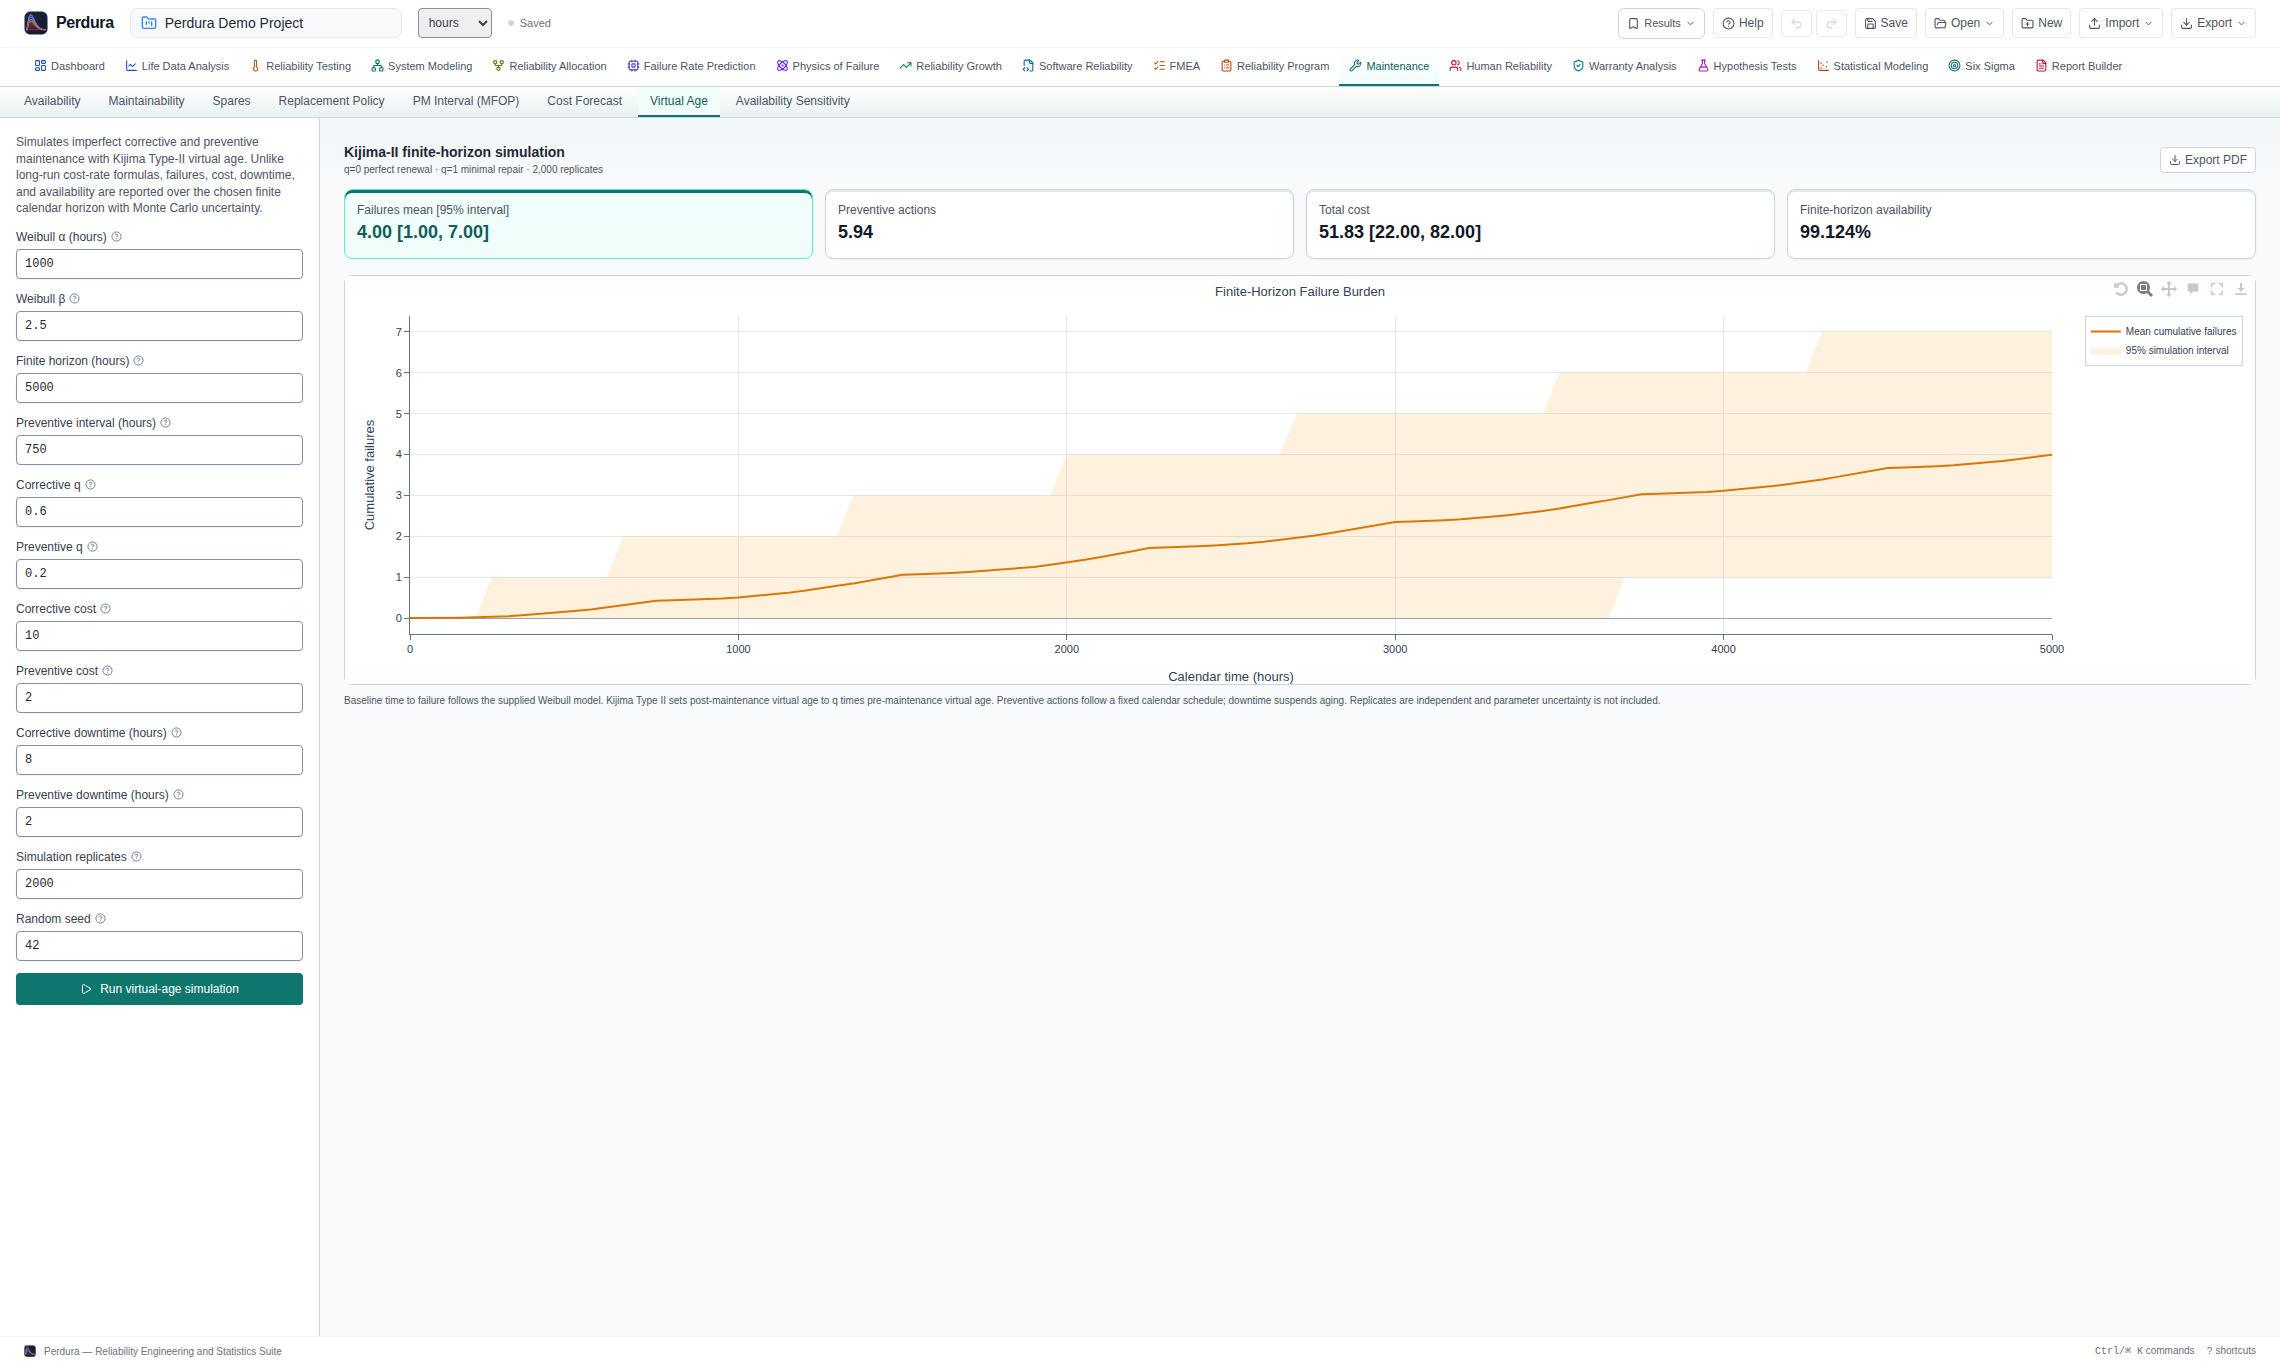
Quantify maintainability and availability; optimize PM intervals, spares and life-cycle cost.
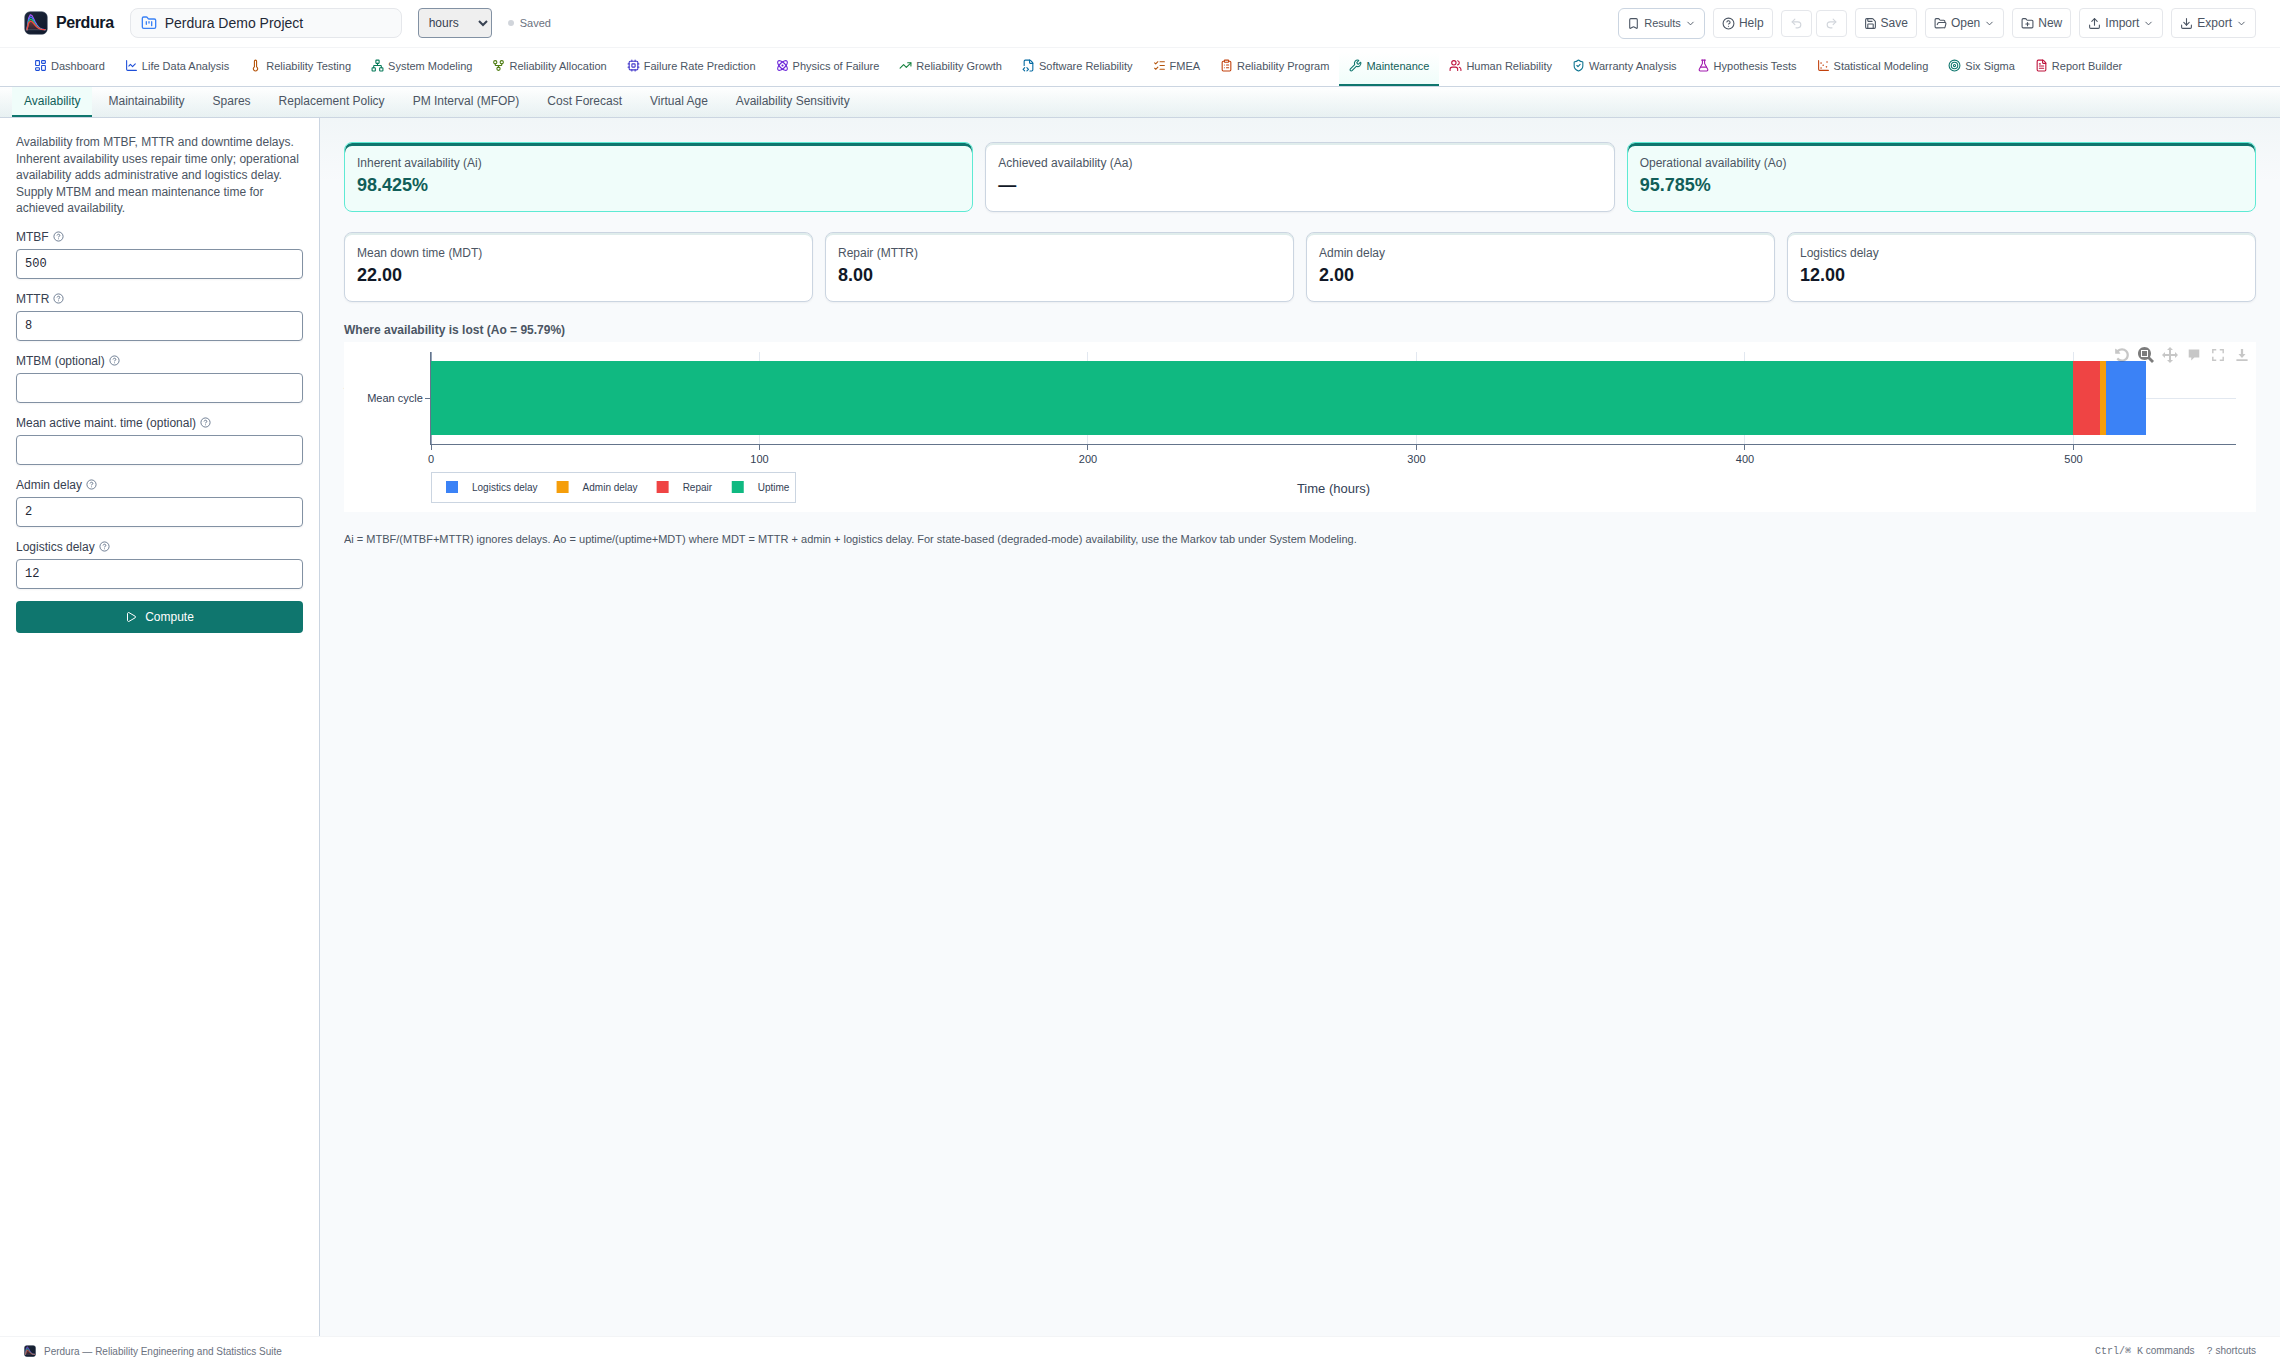
- Inherent, achieved and operational availability with downtime-breakdown visualization
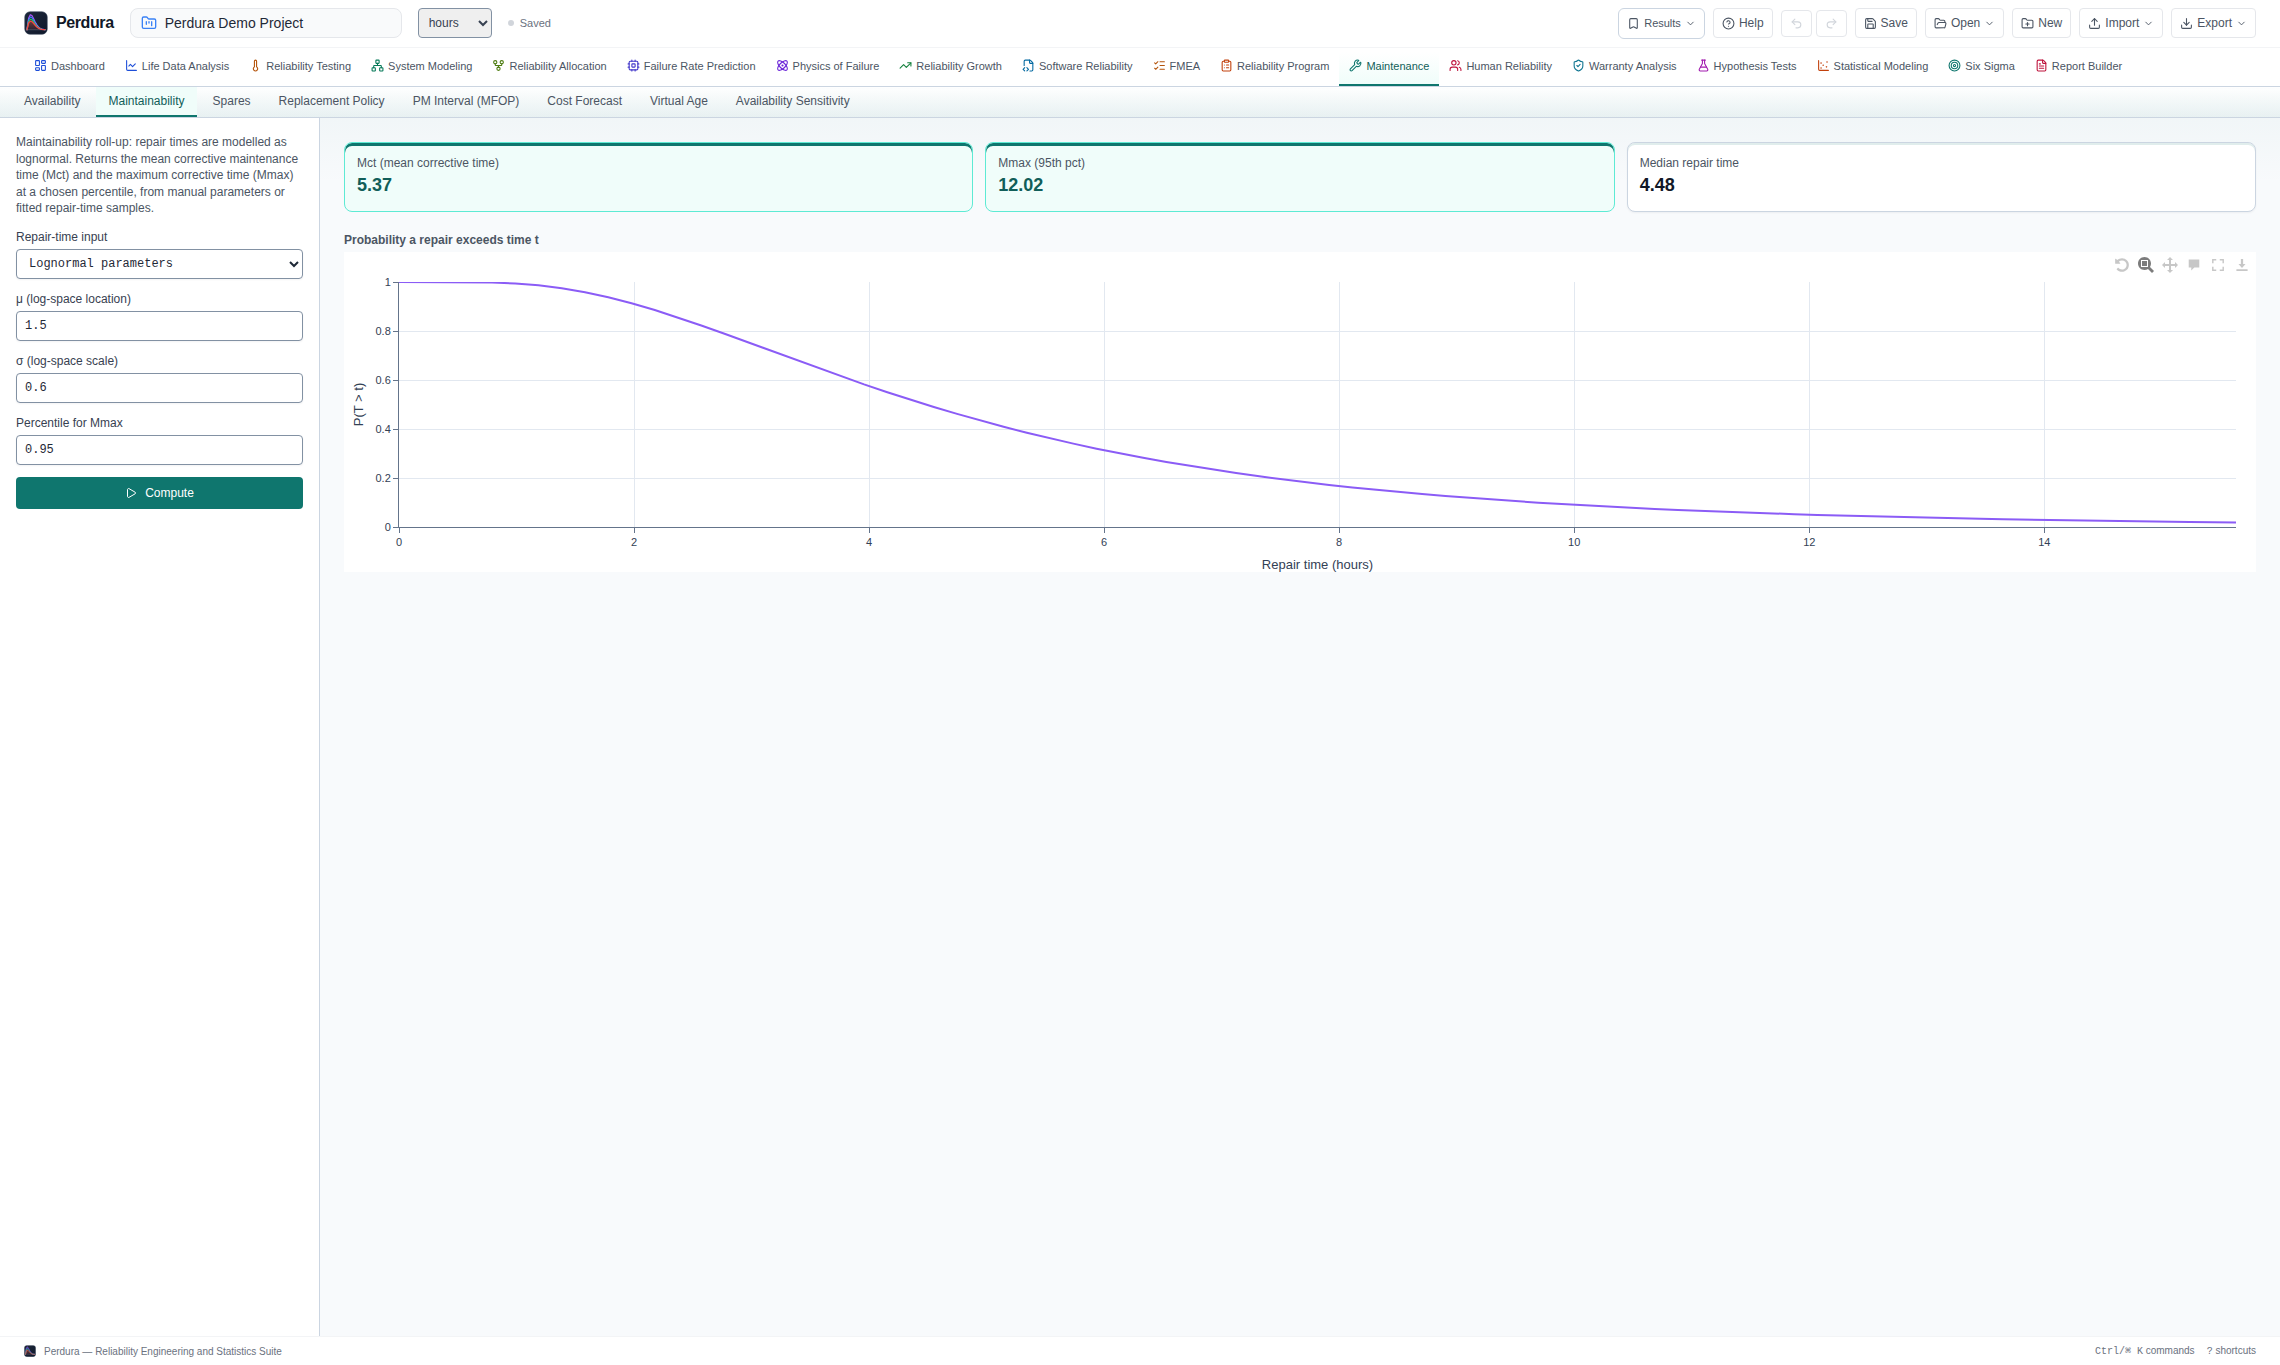
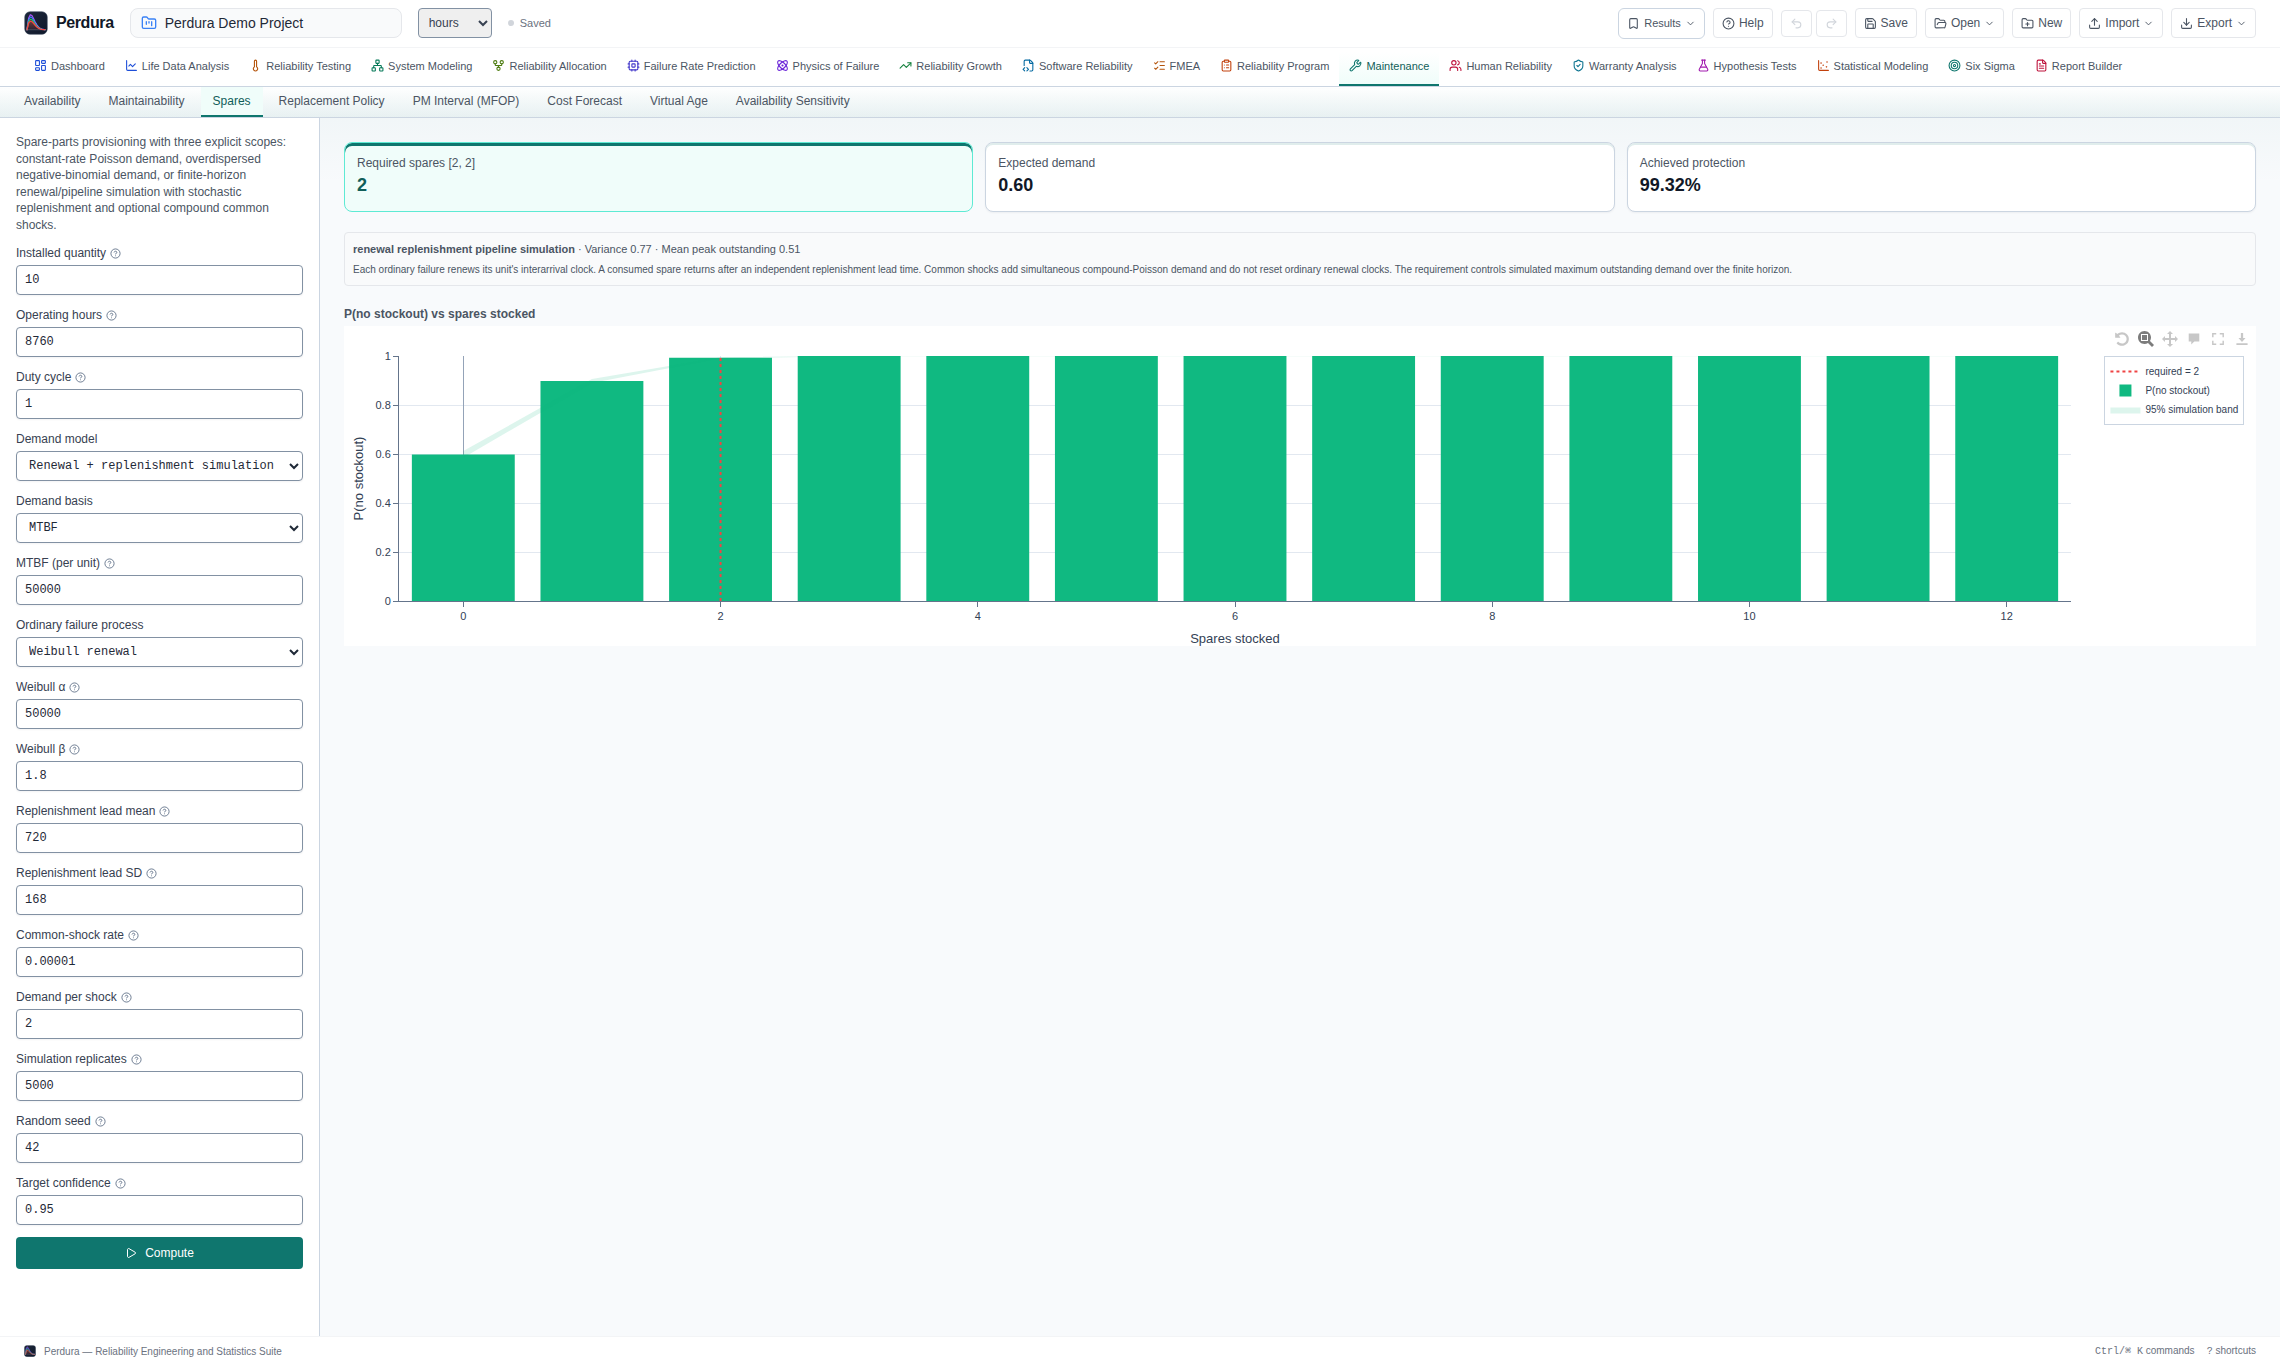
- Poisson spare-parts provisioning and lognormal corrective-maintenance time rollup (Mct, Mmax)
- Age- versus block-replacement policy comparison with optimum PM interval and cost per unit time
- Maintenance-free operating period (MFOP) and service-interval targets with sawtooth reliability profiles
- Life-cycle cost forecasting and sensitivity analysis for operational availability
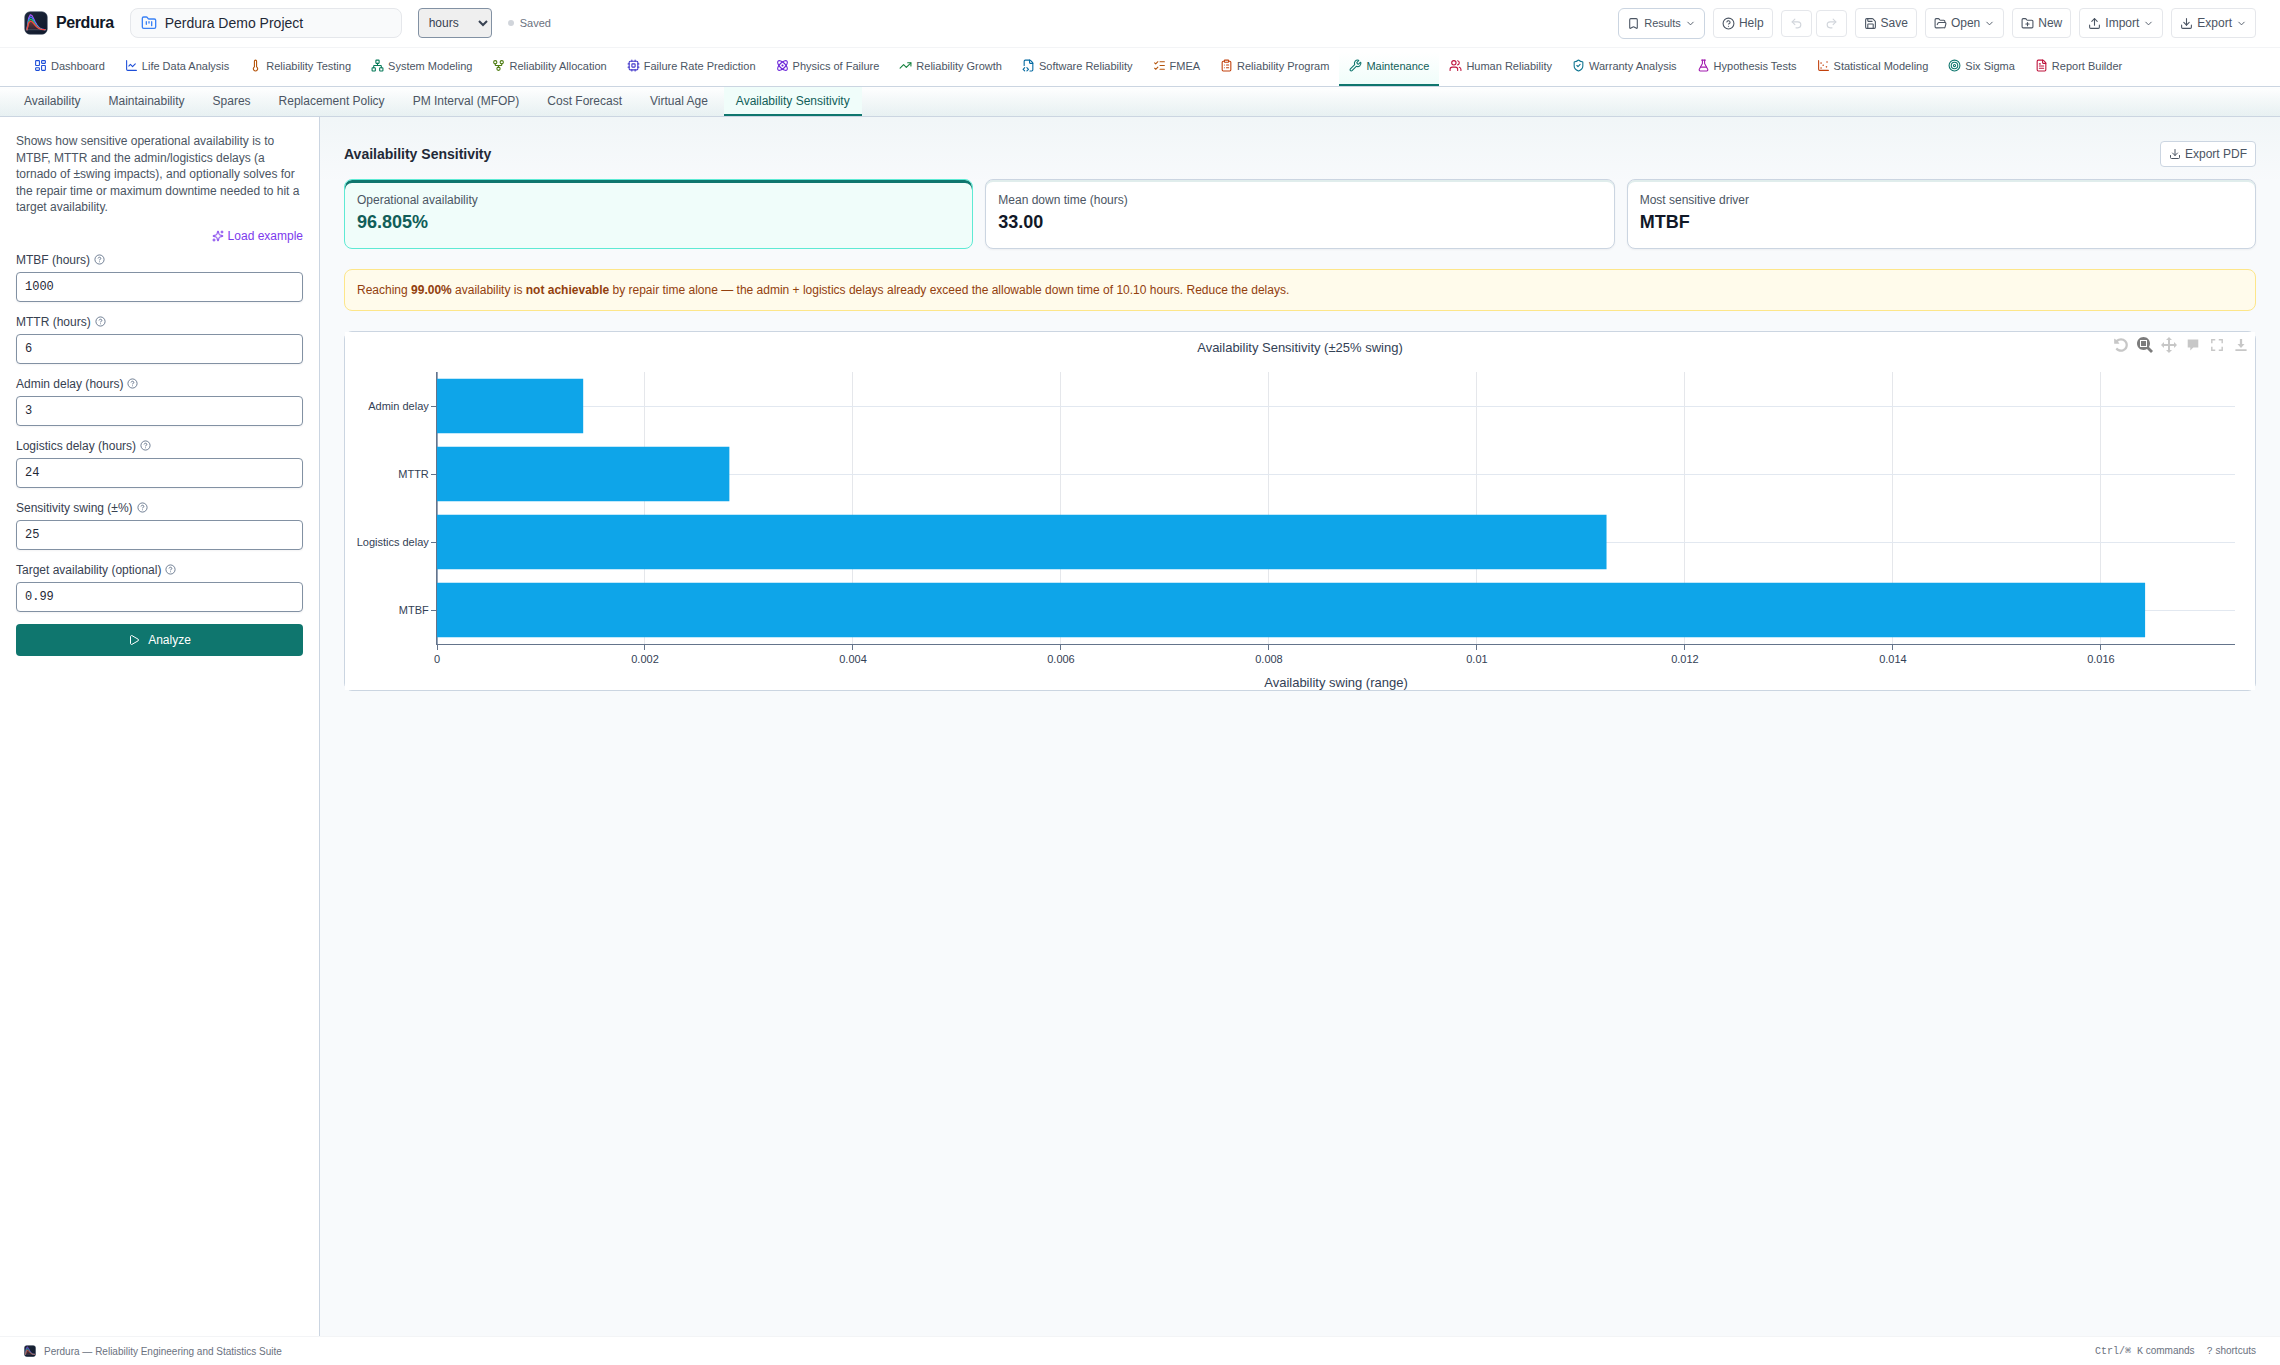
Use the arrows, arrow keys, or swipe to review each analysis. Open an image for full resolution.
Human Reliability Analysis (HRA)
Estimate or screen human-error contributors using quantitative methods and explicitly scoped qualitative workflows.
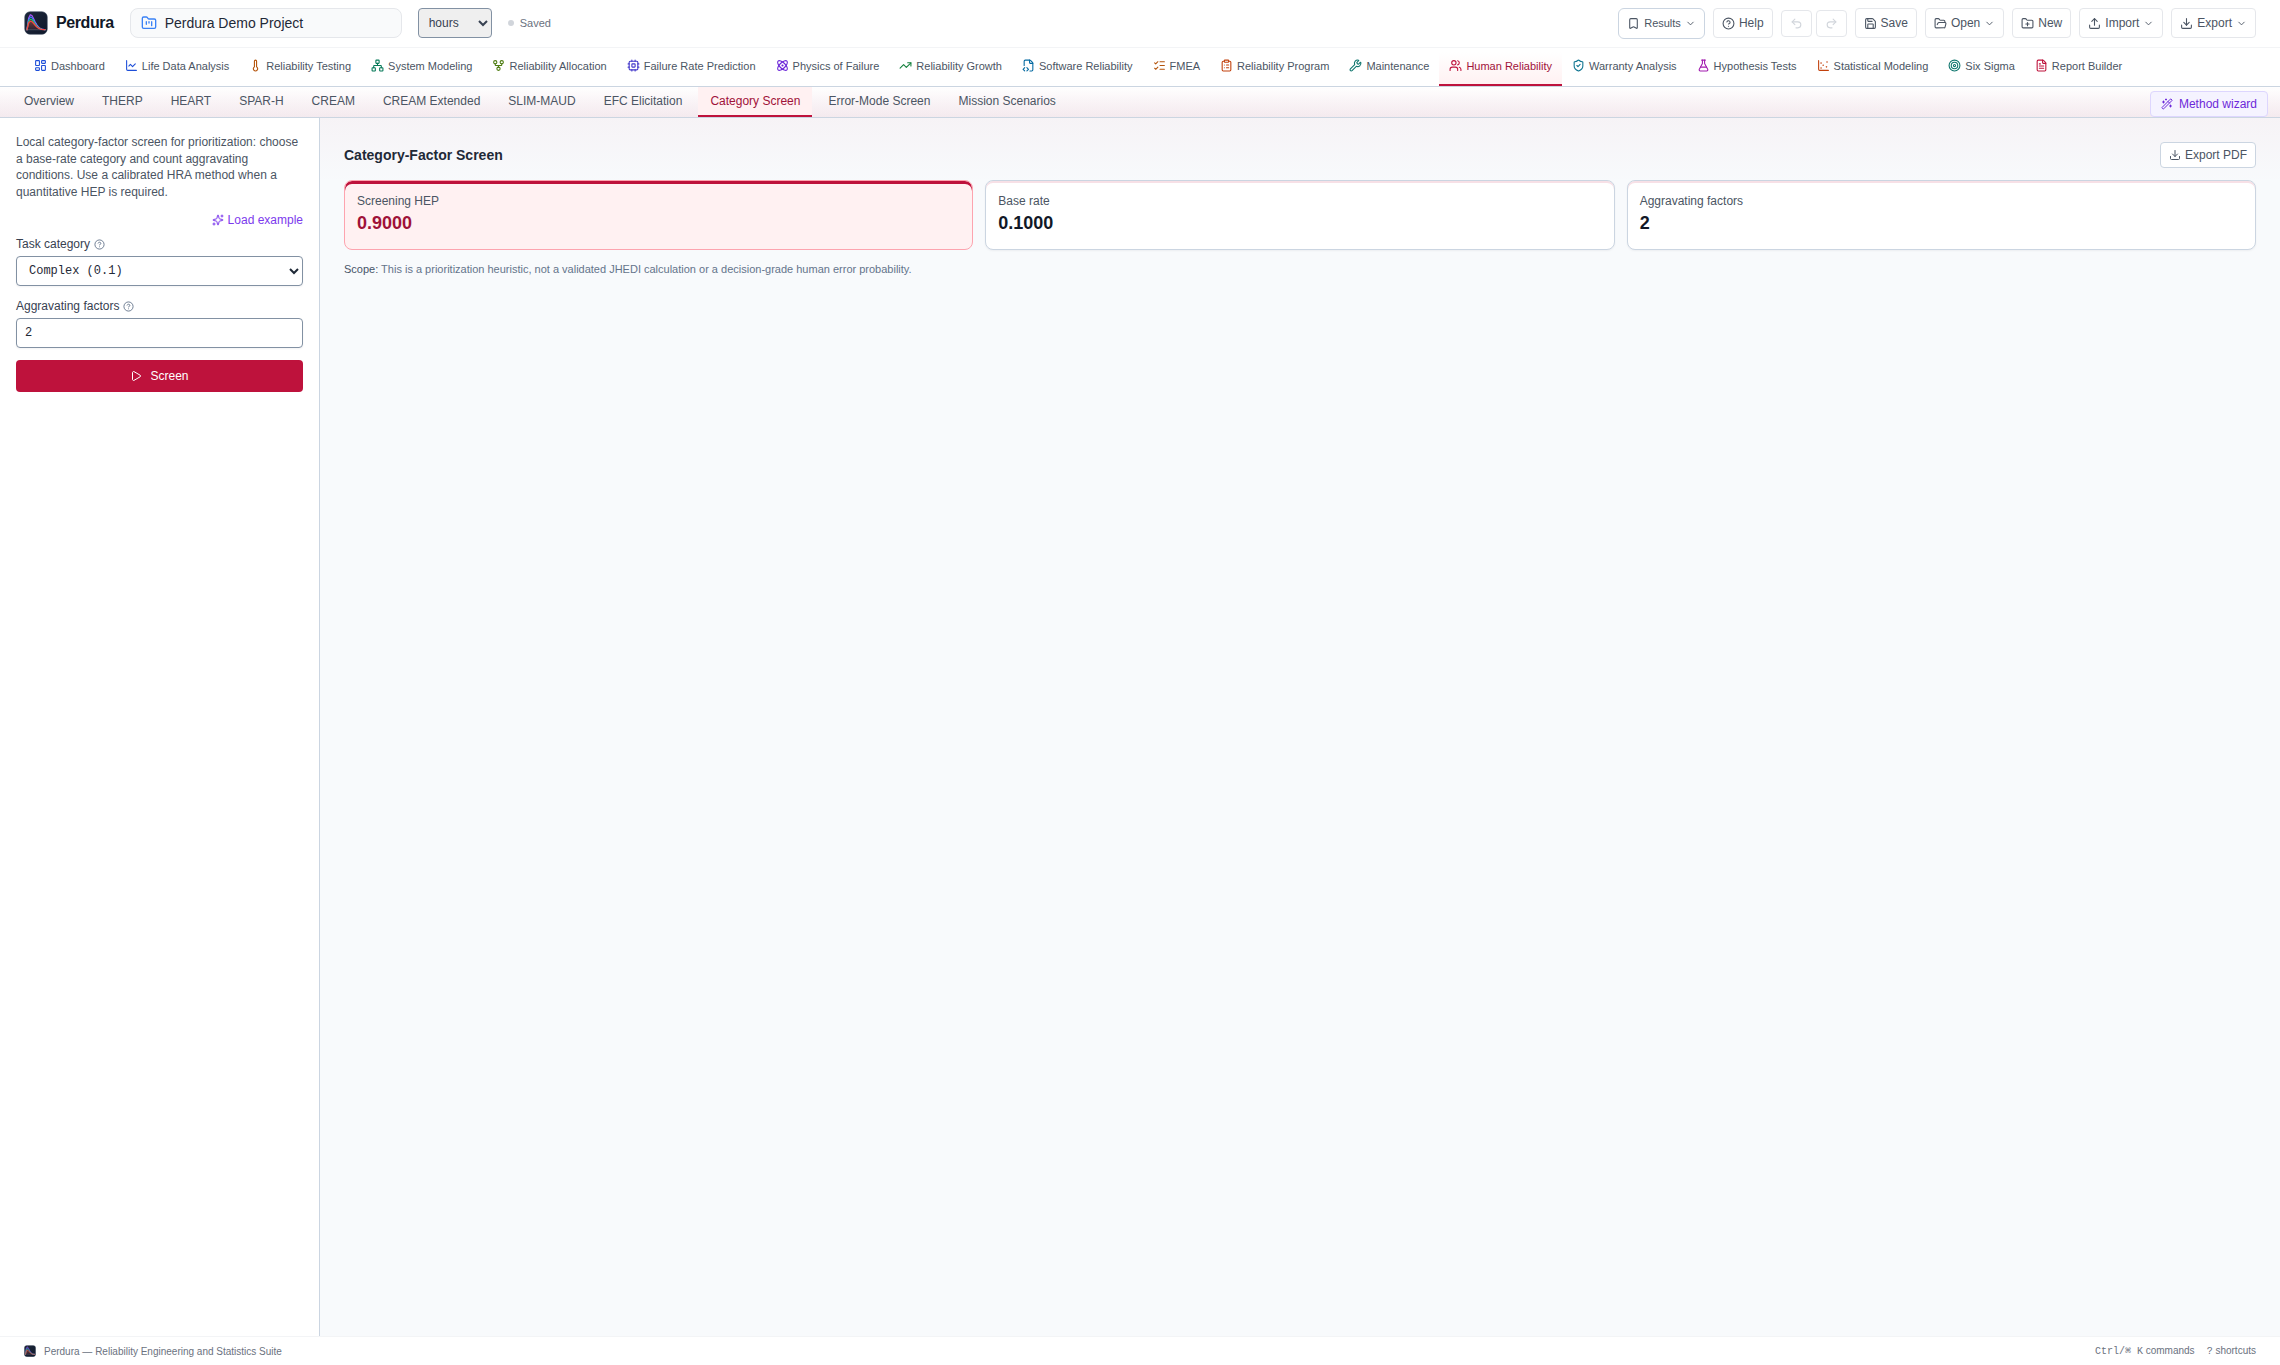
- Human error probability (HEP) calculations with THERP, HEART, SPAR-H, basic CREAM and SLIM-MAUD
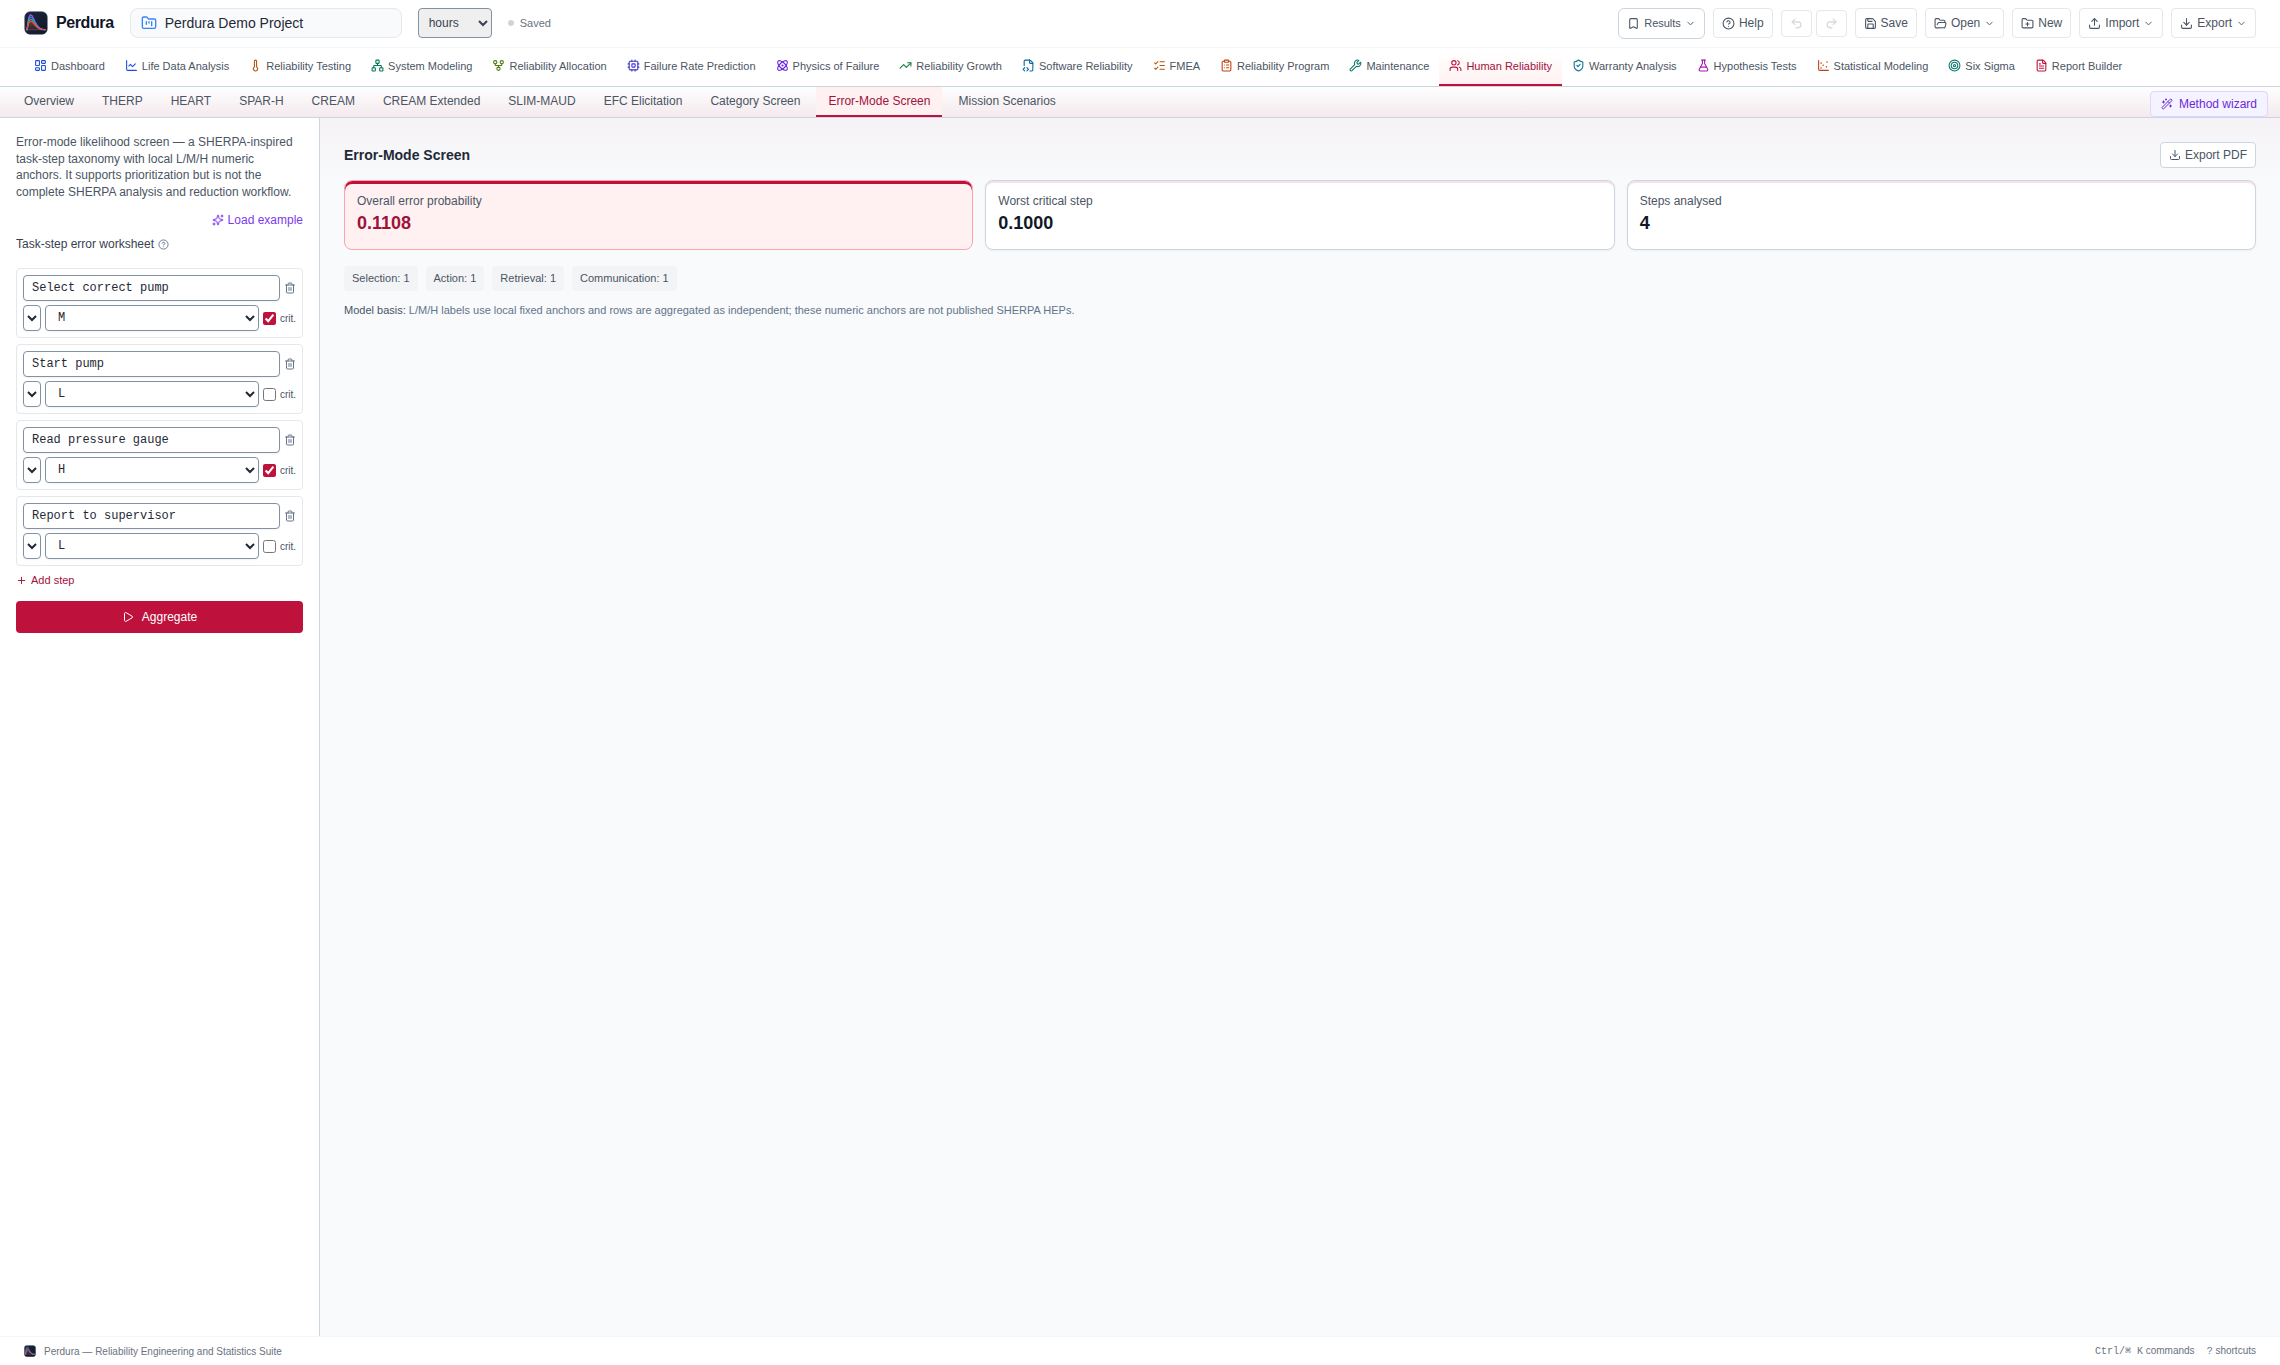
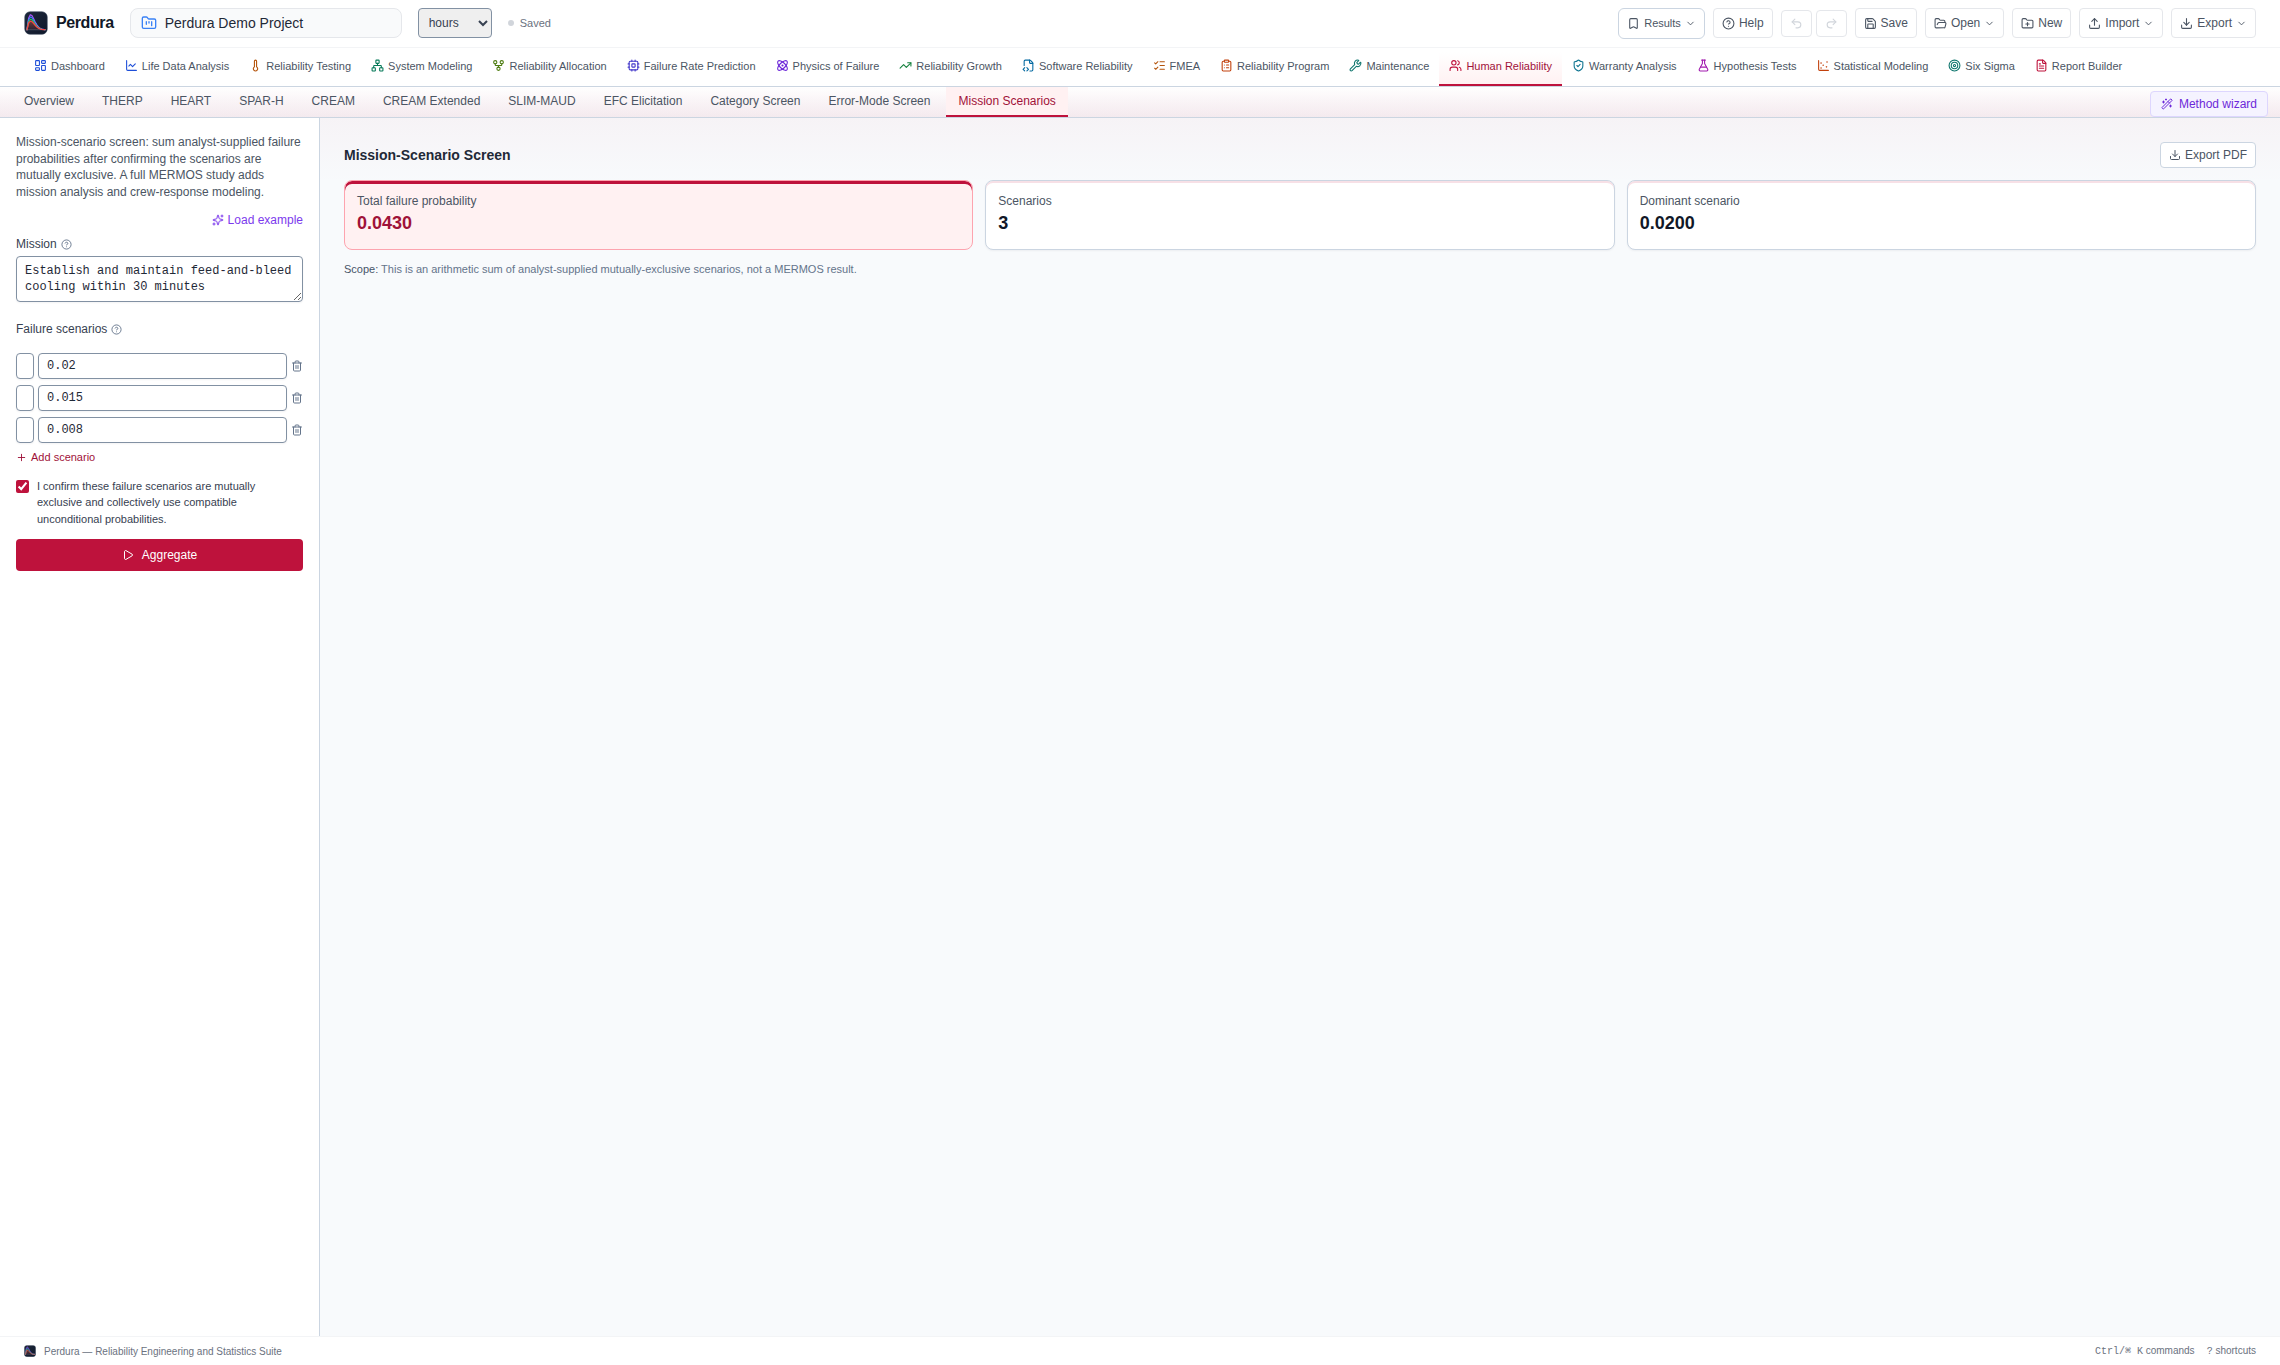
- Structured, explicitly scoped screening worksheets inspired by ATHEANA, SHERPA, MERMOS and JHEDI
- Extended CREAM analysis with cognitive-activity steps and control-mode assessment
- Cross-method overview of the latest HEP estimates

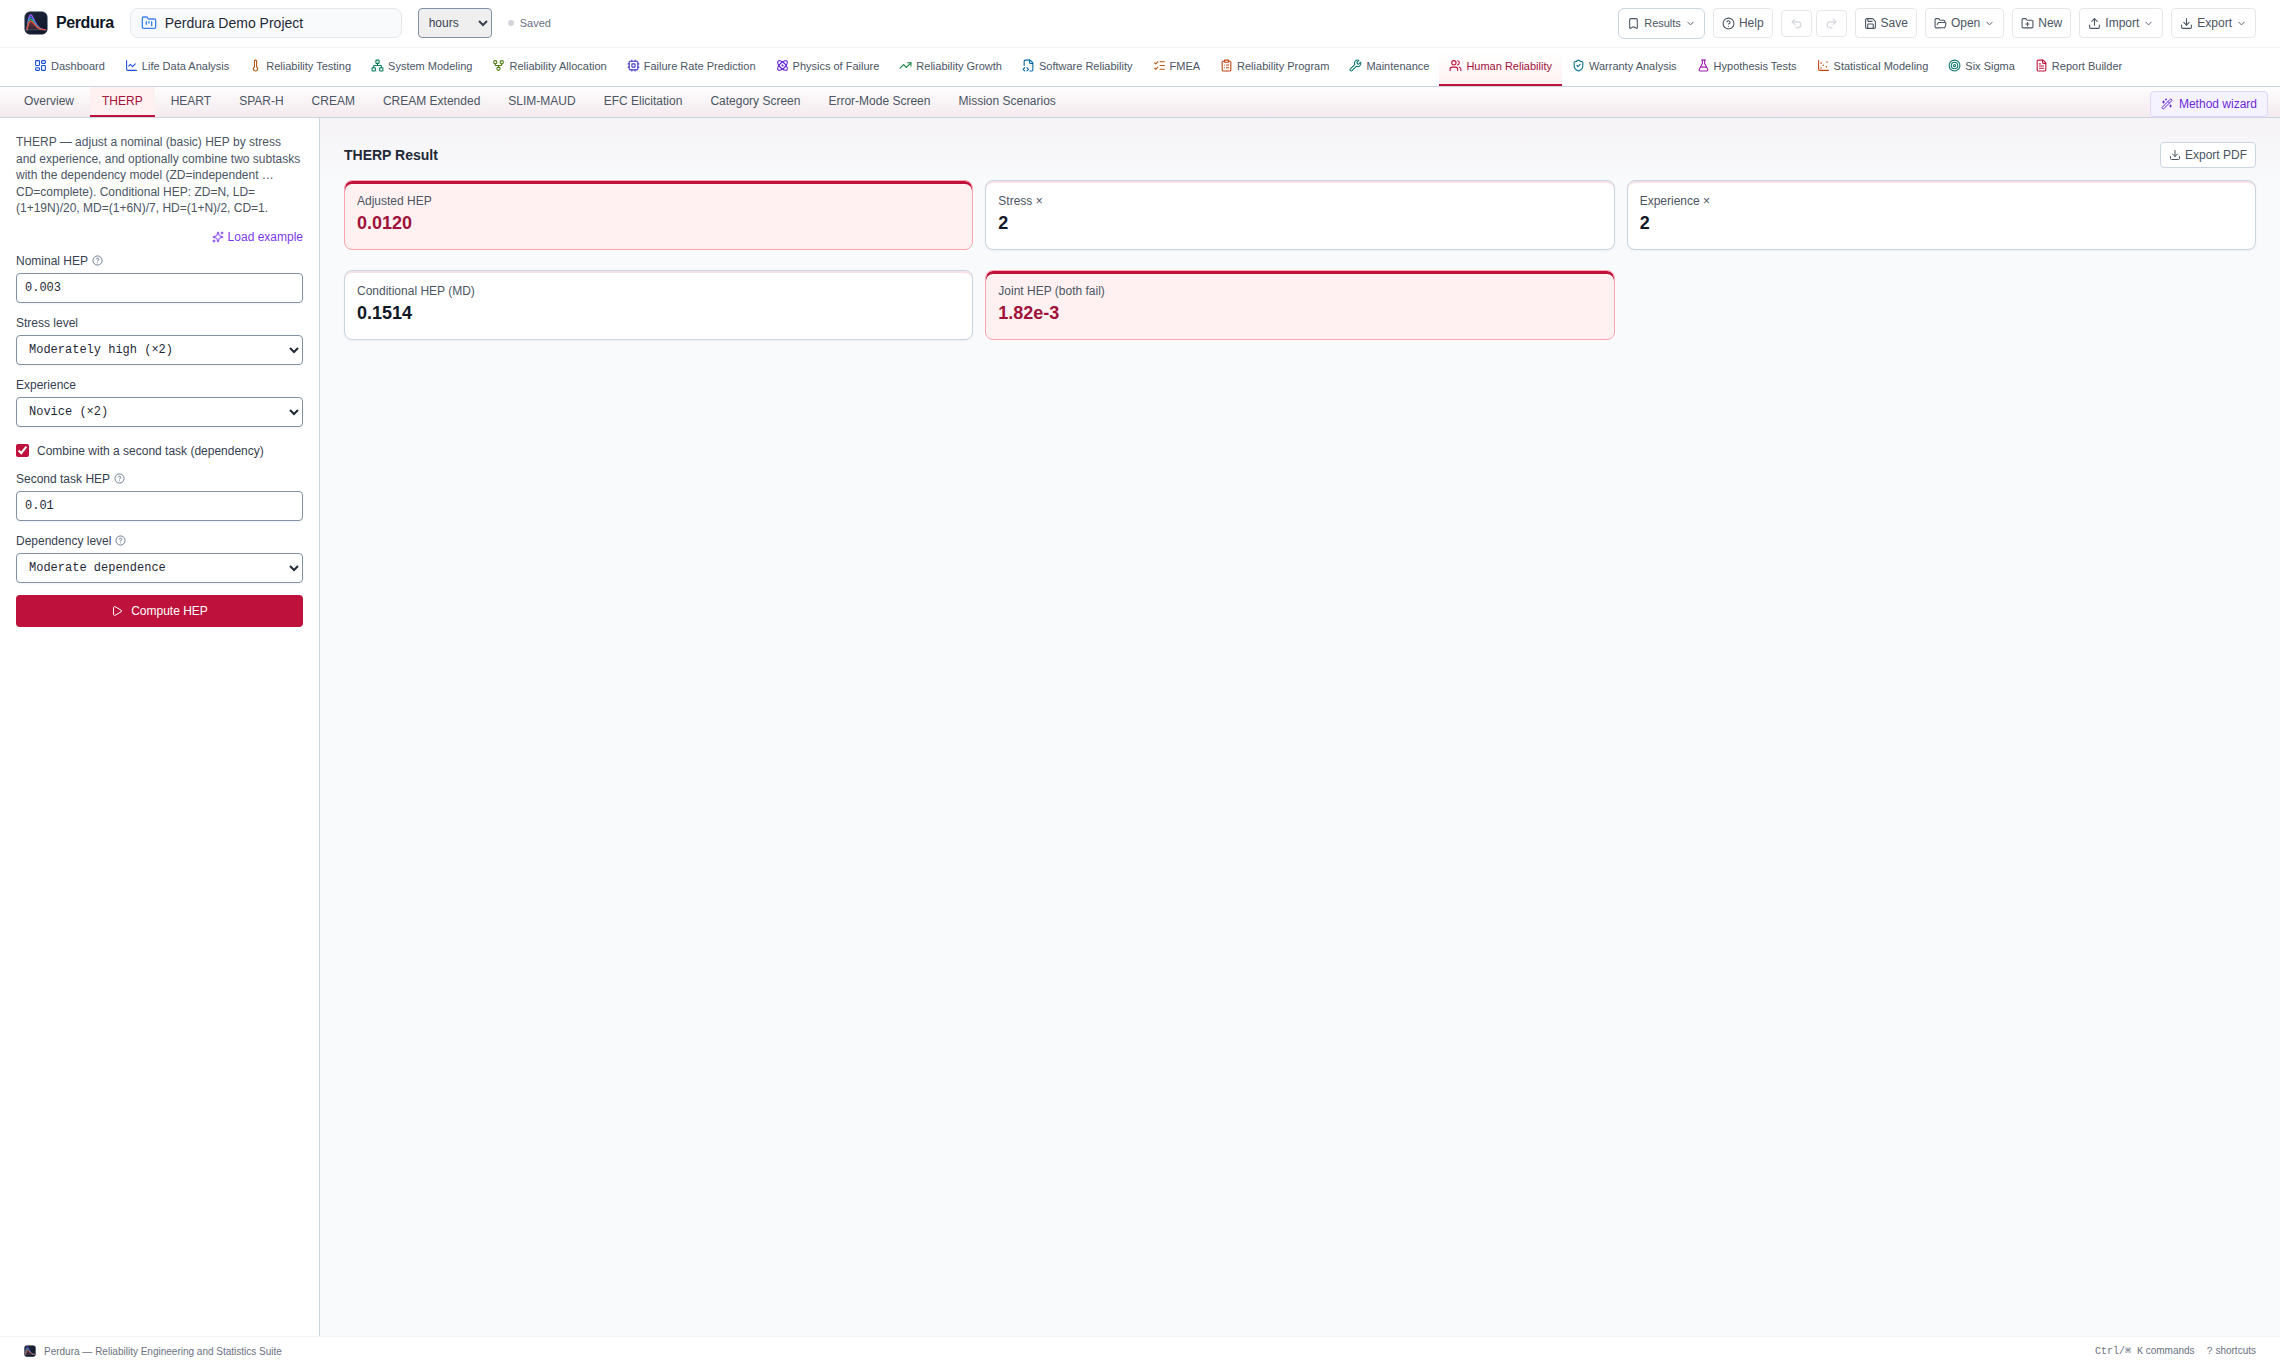
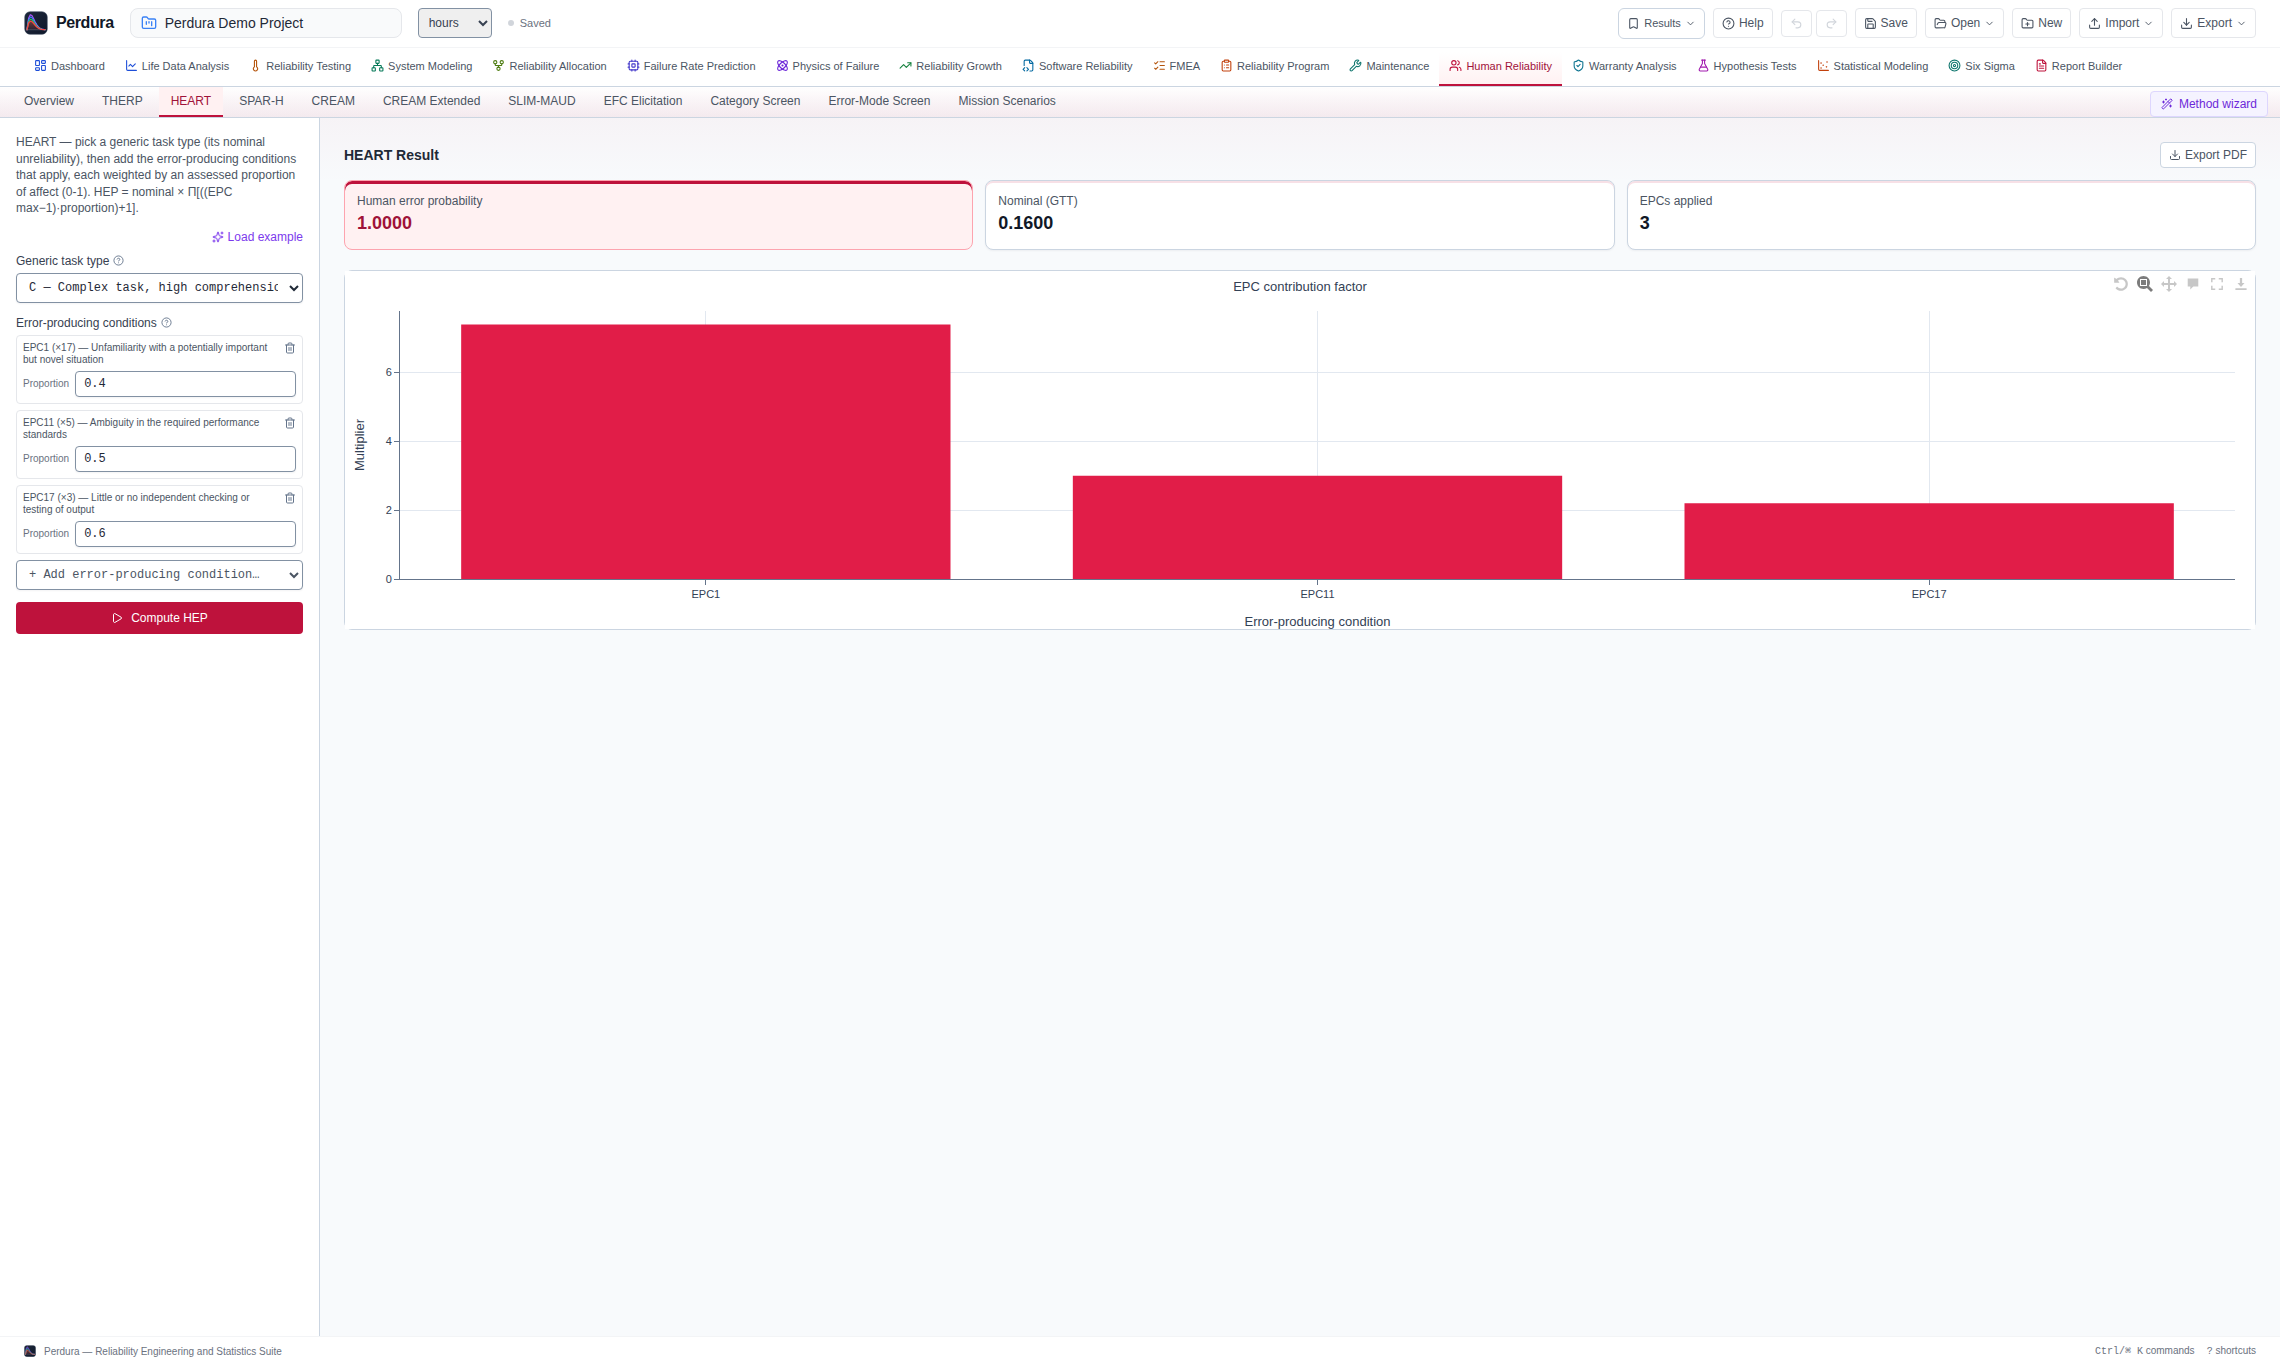
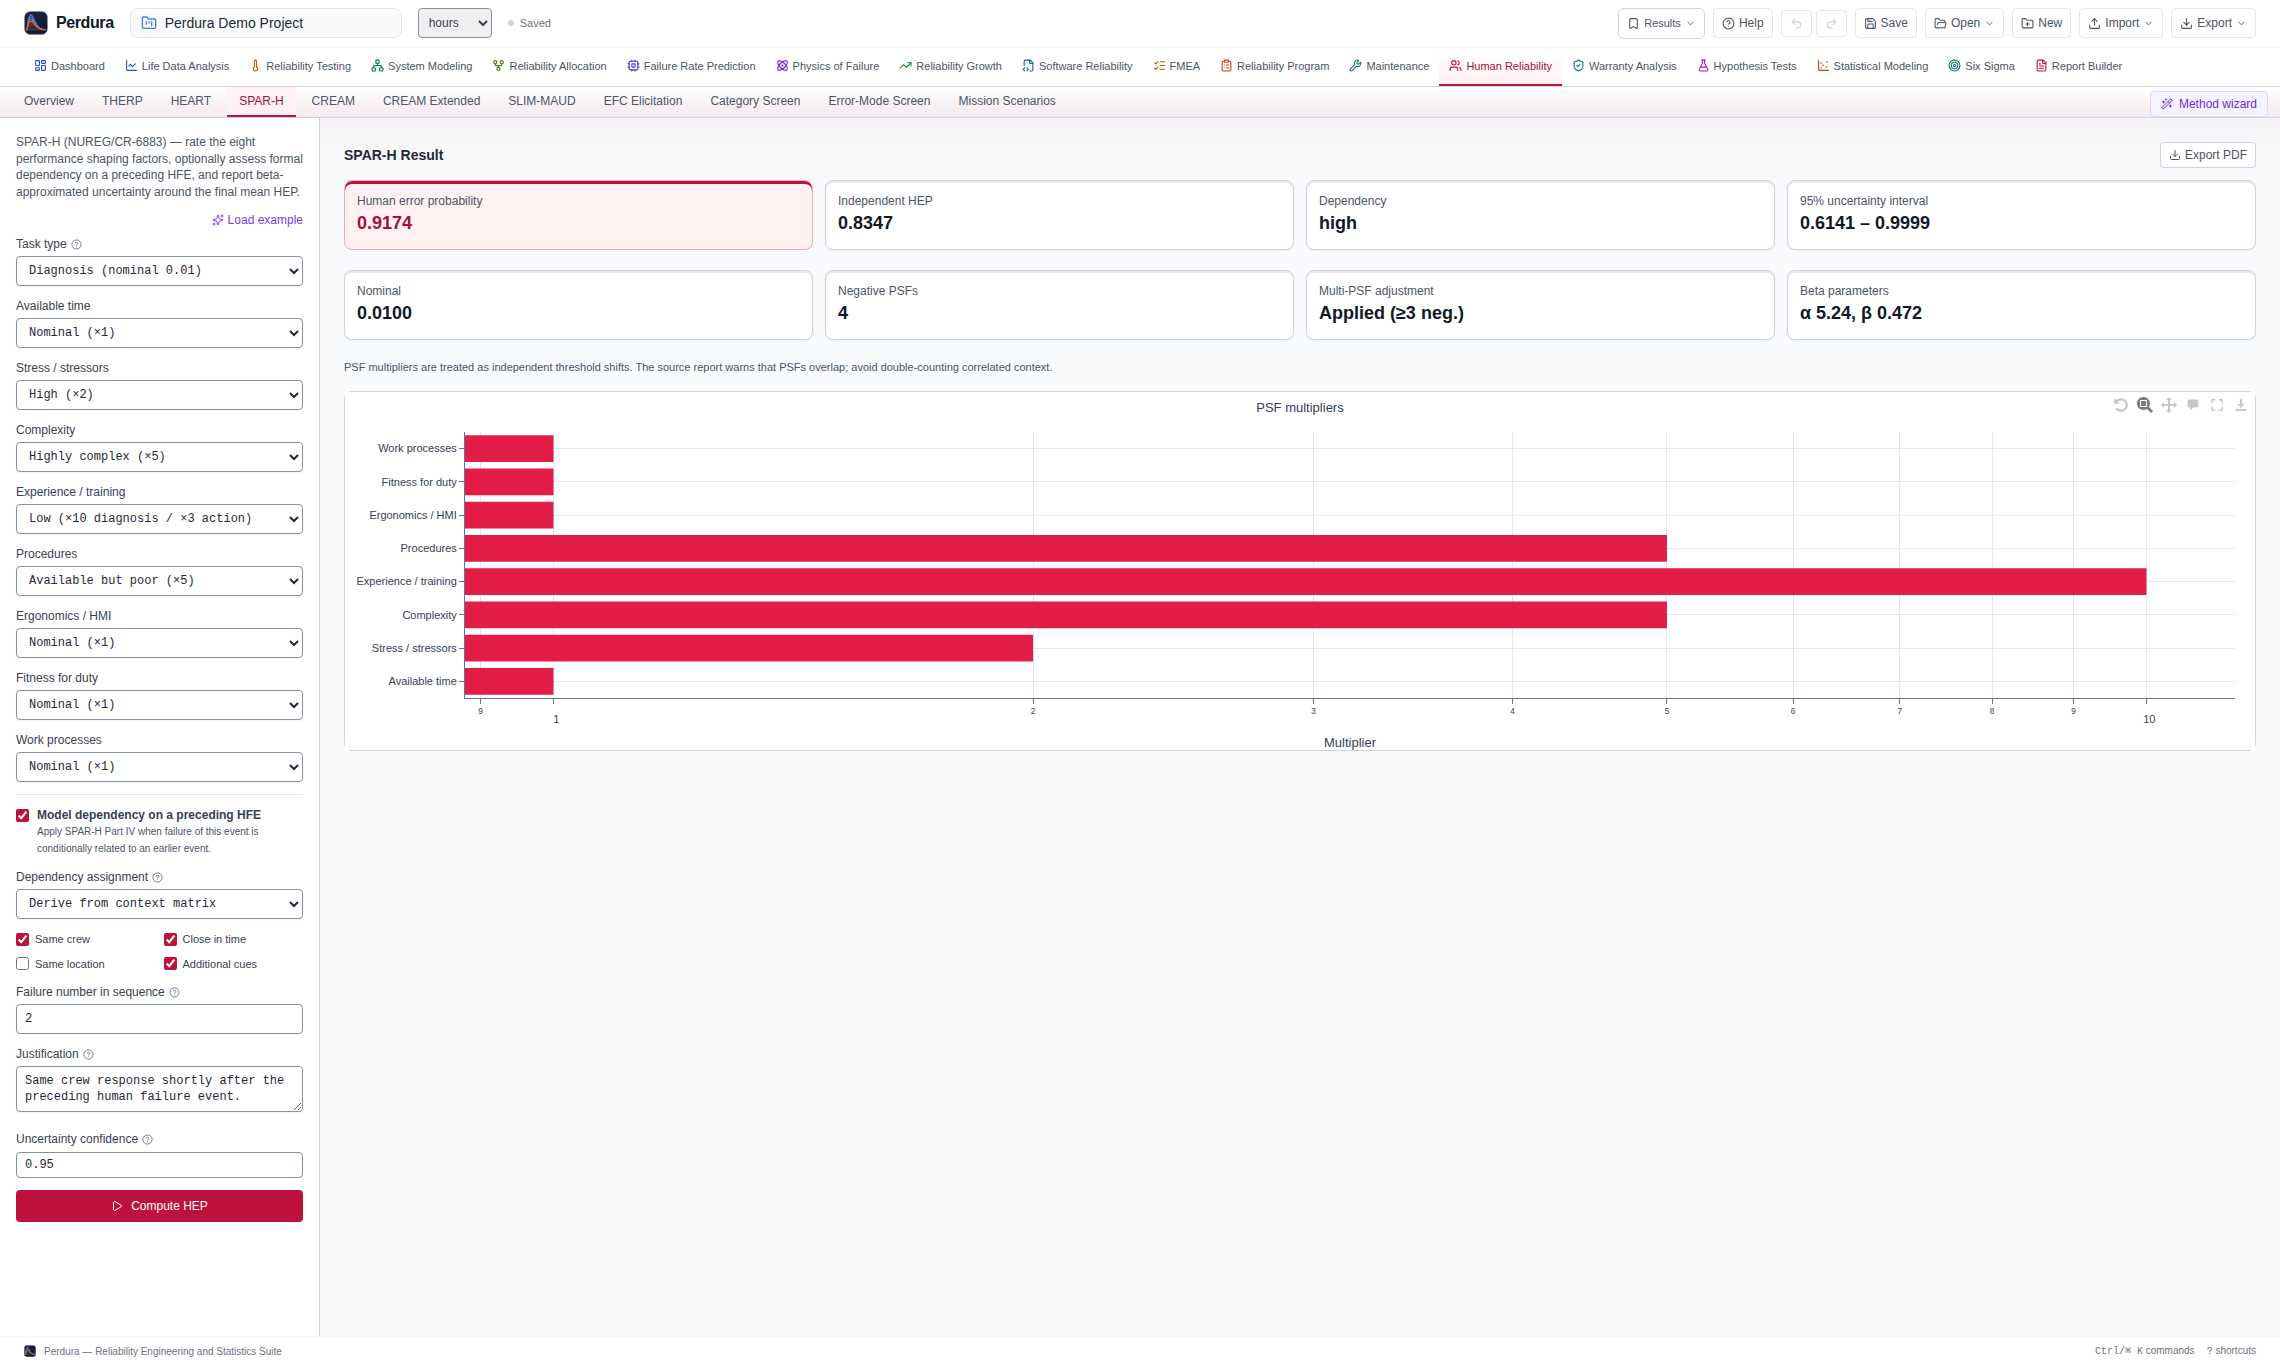
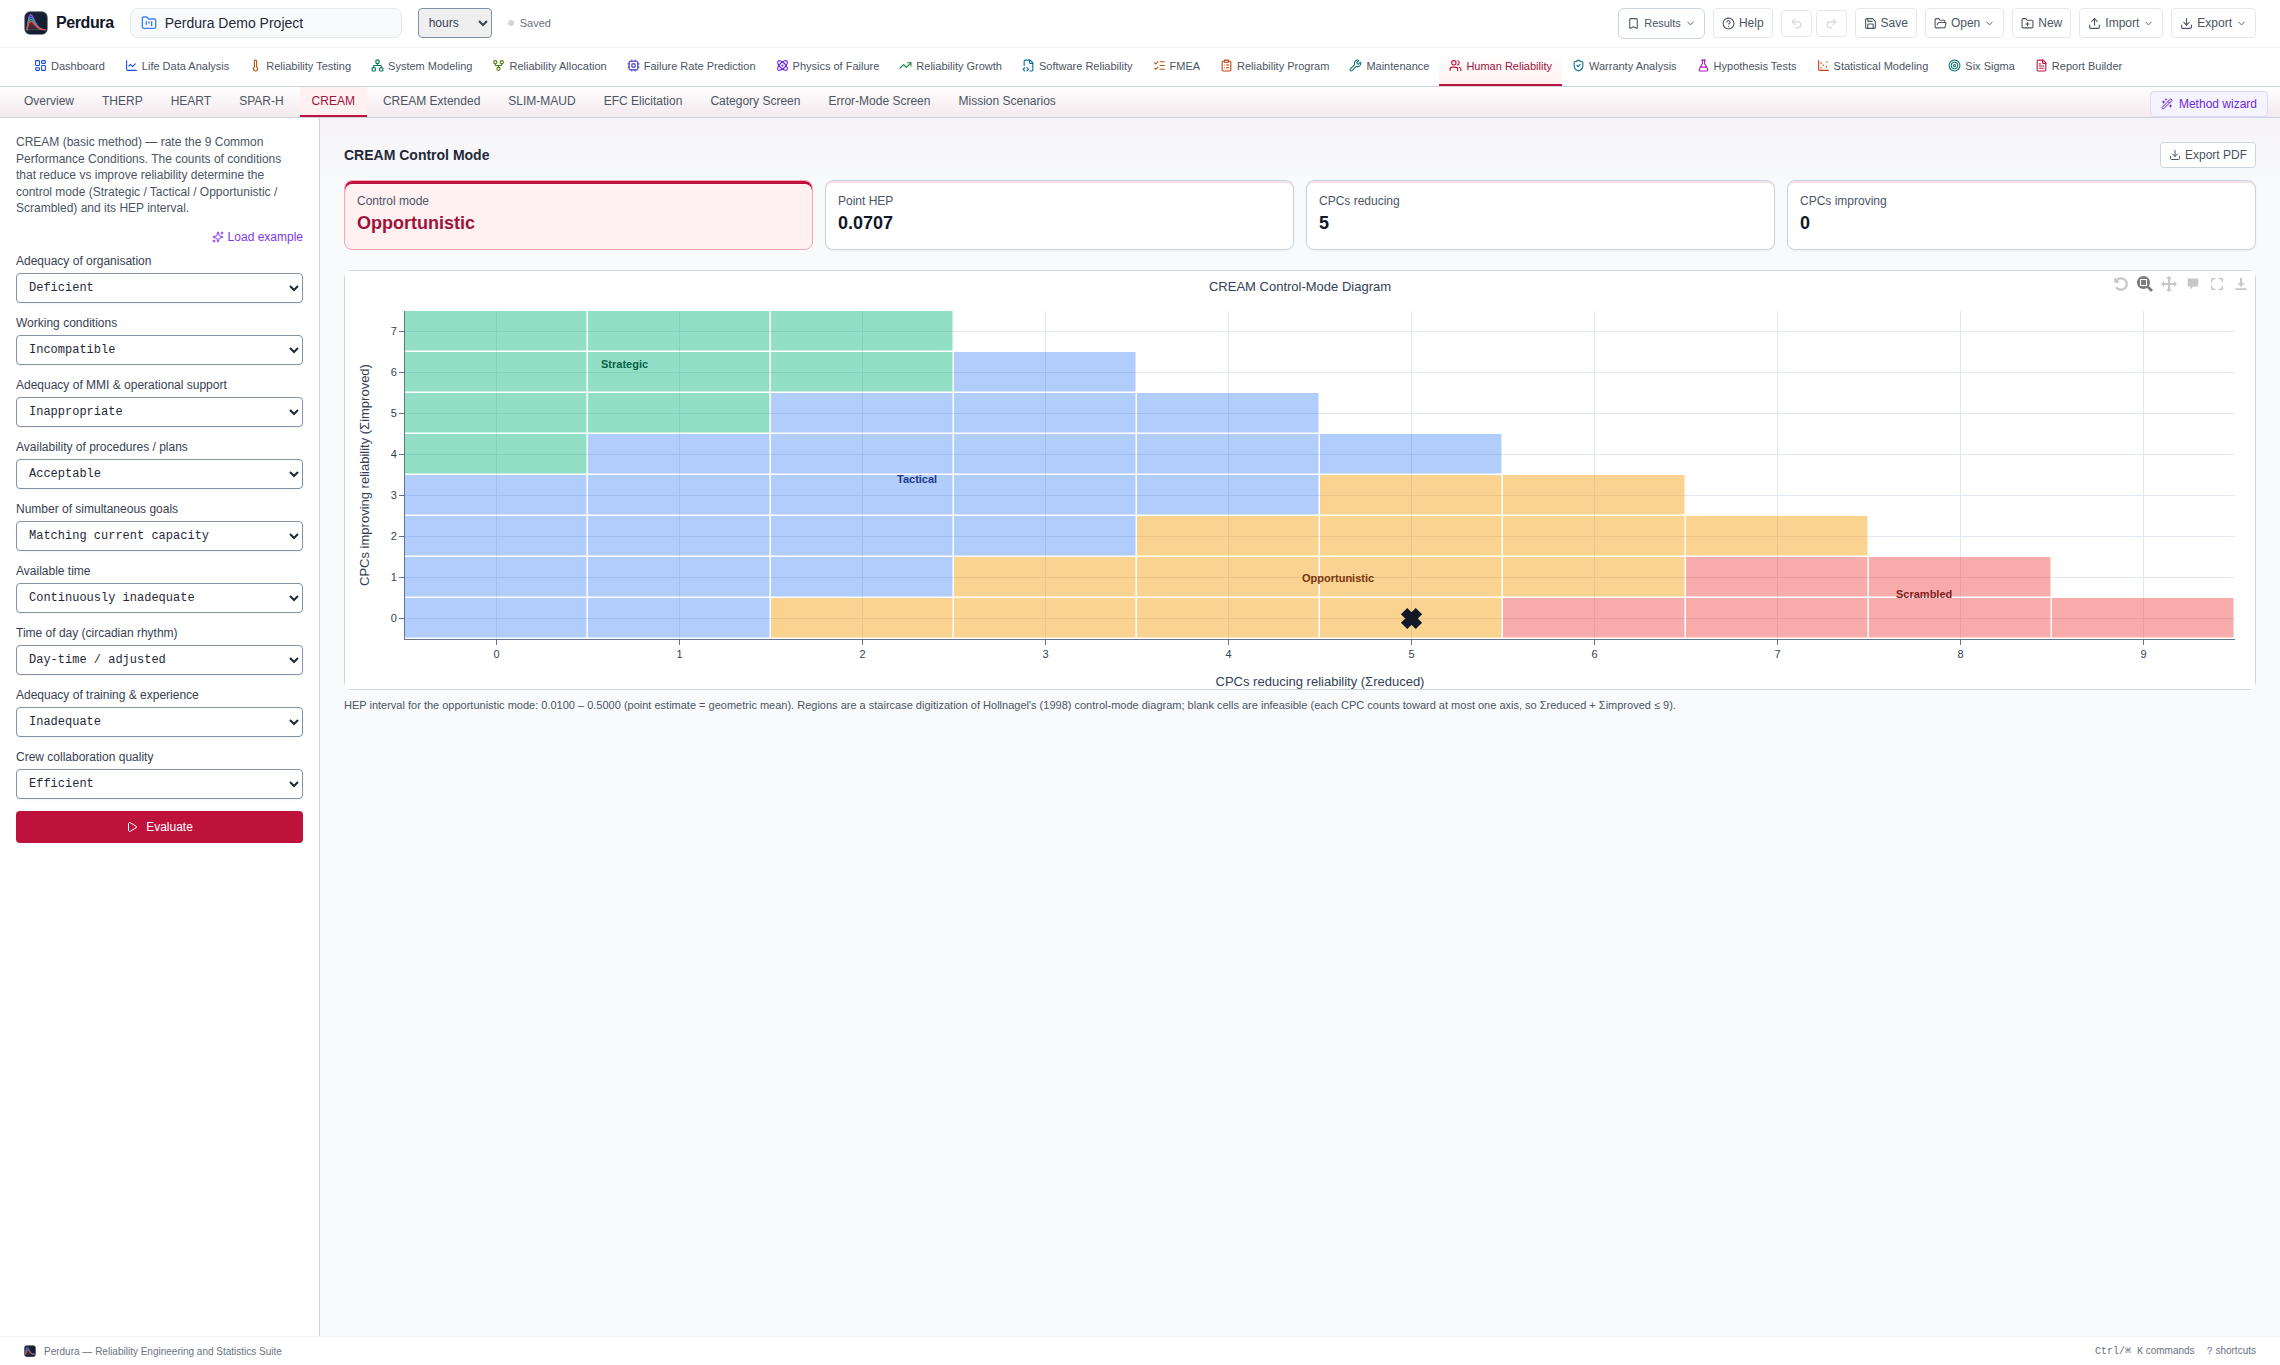
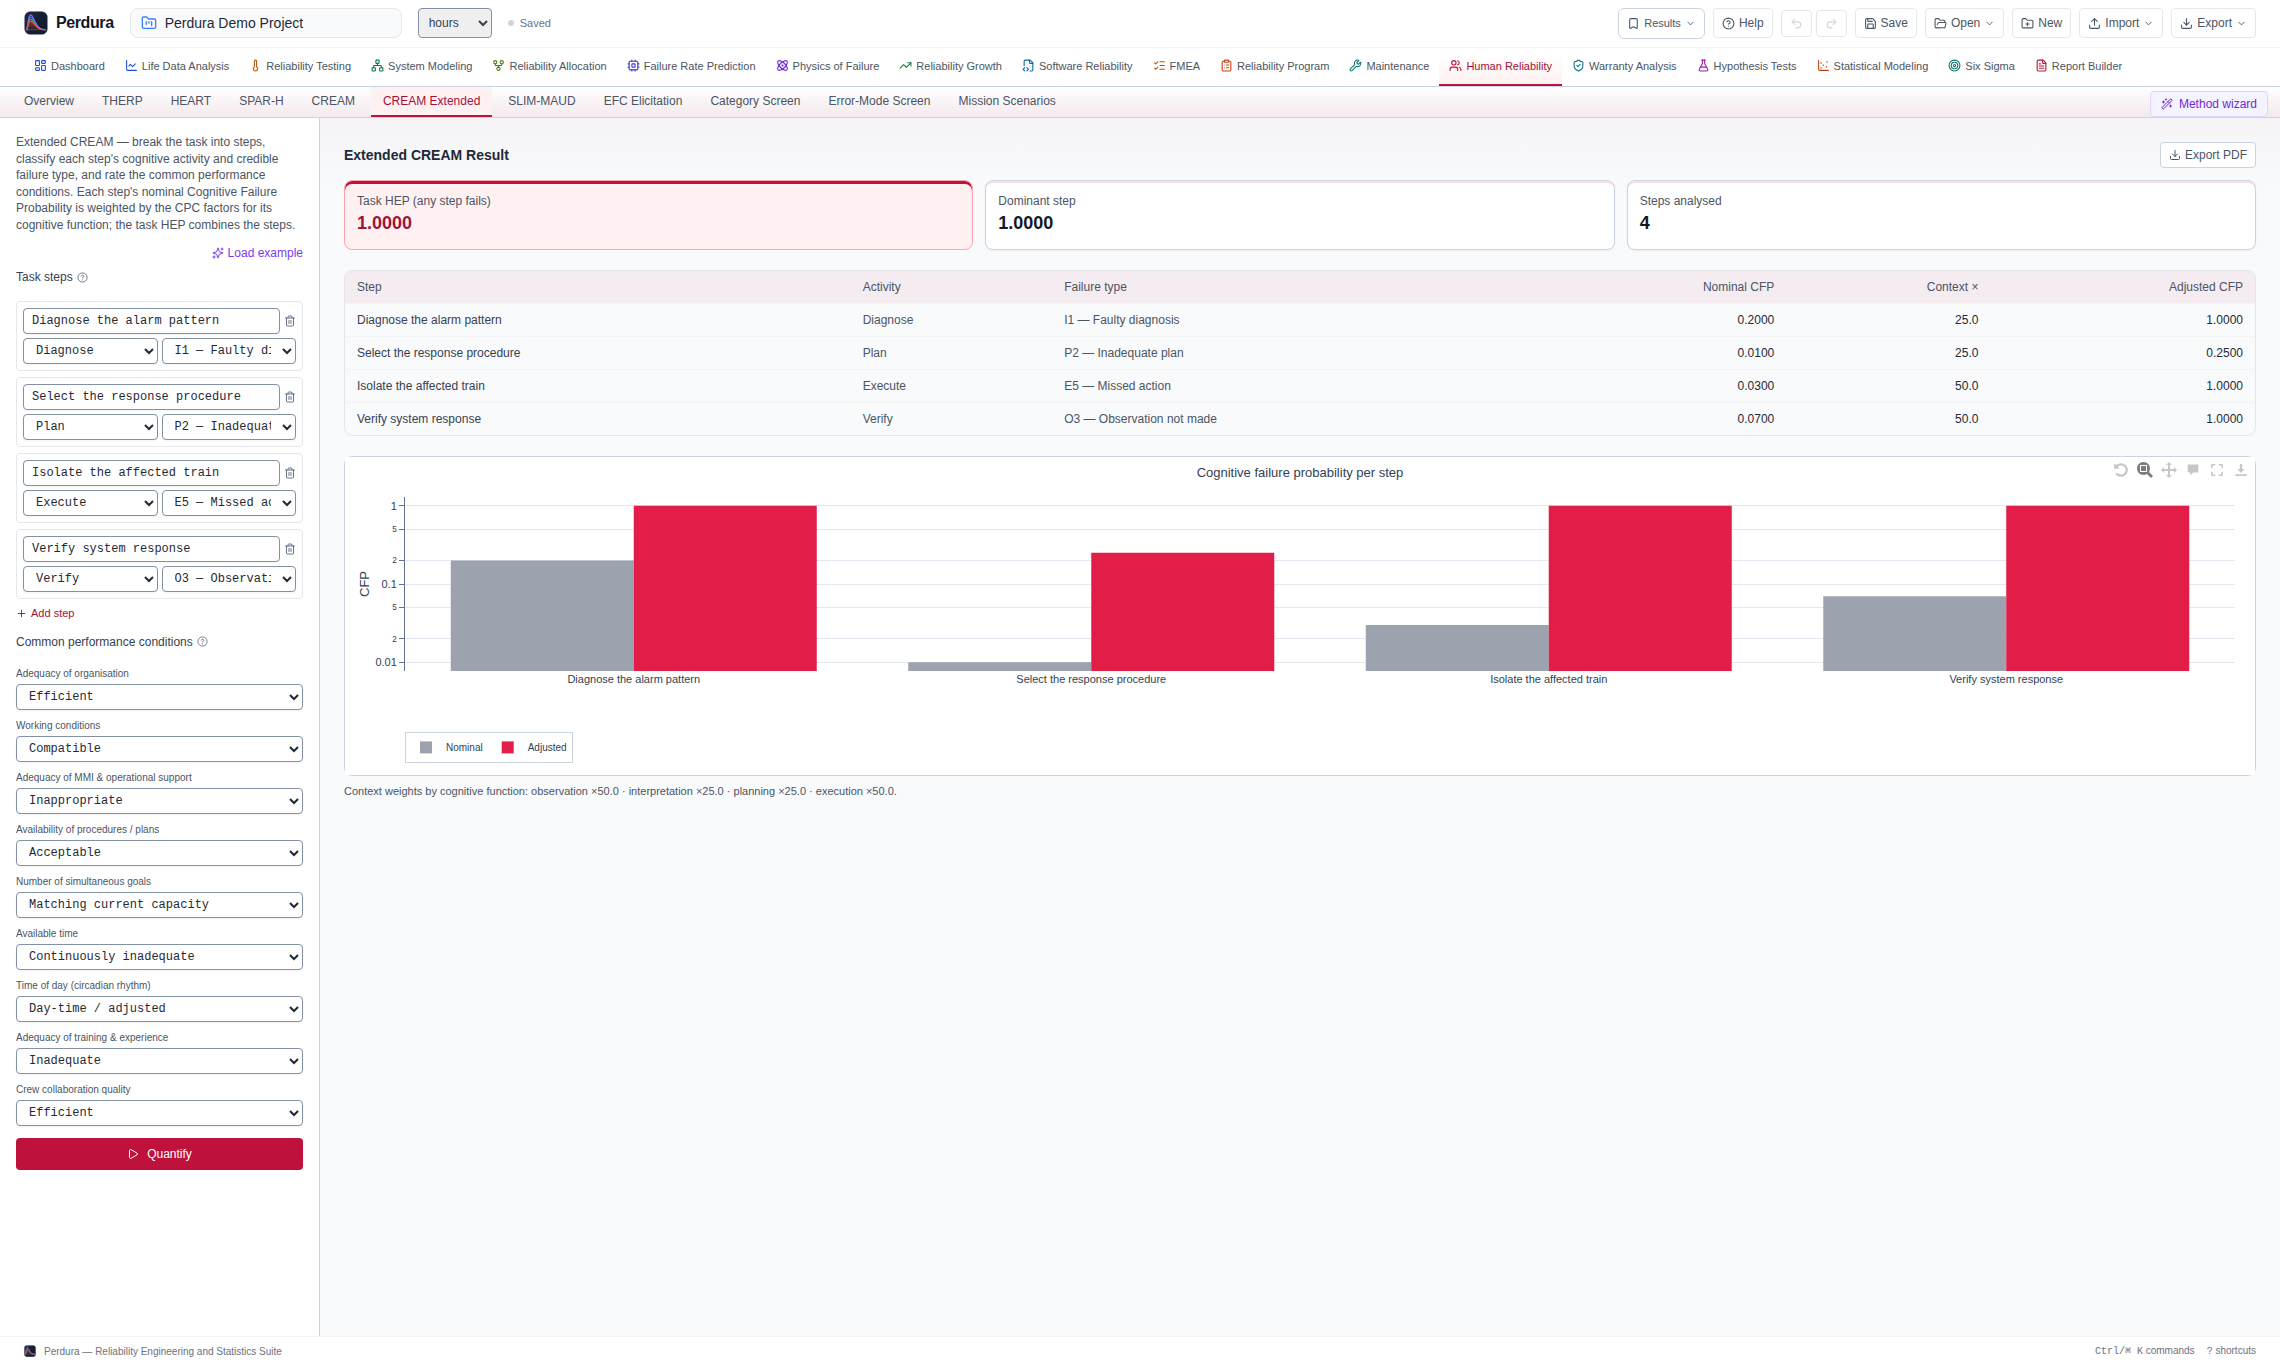
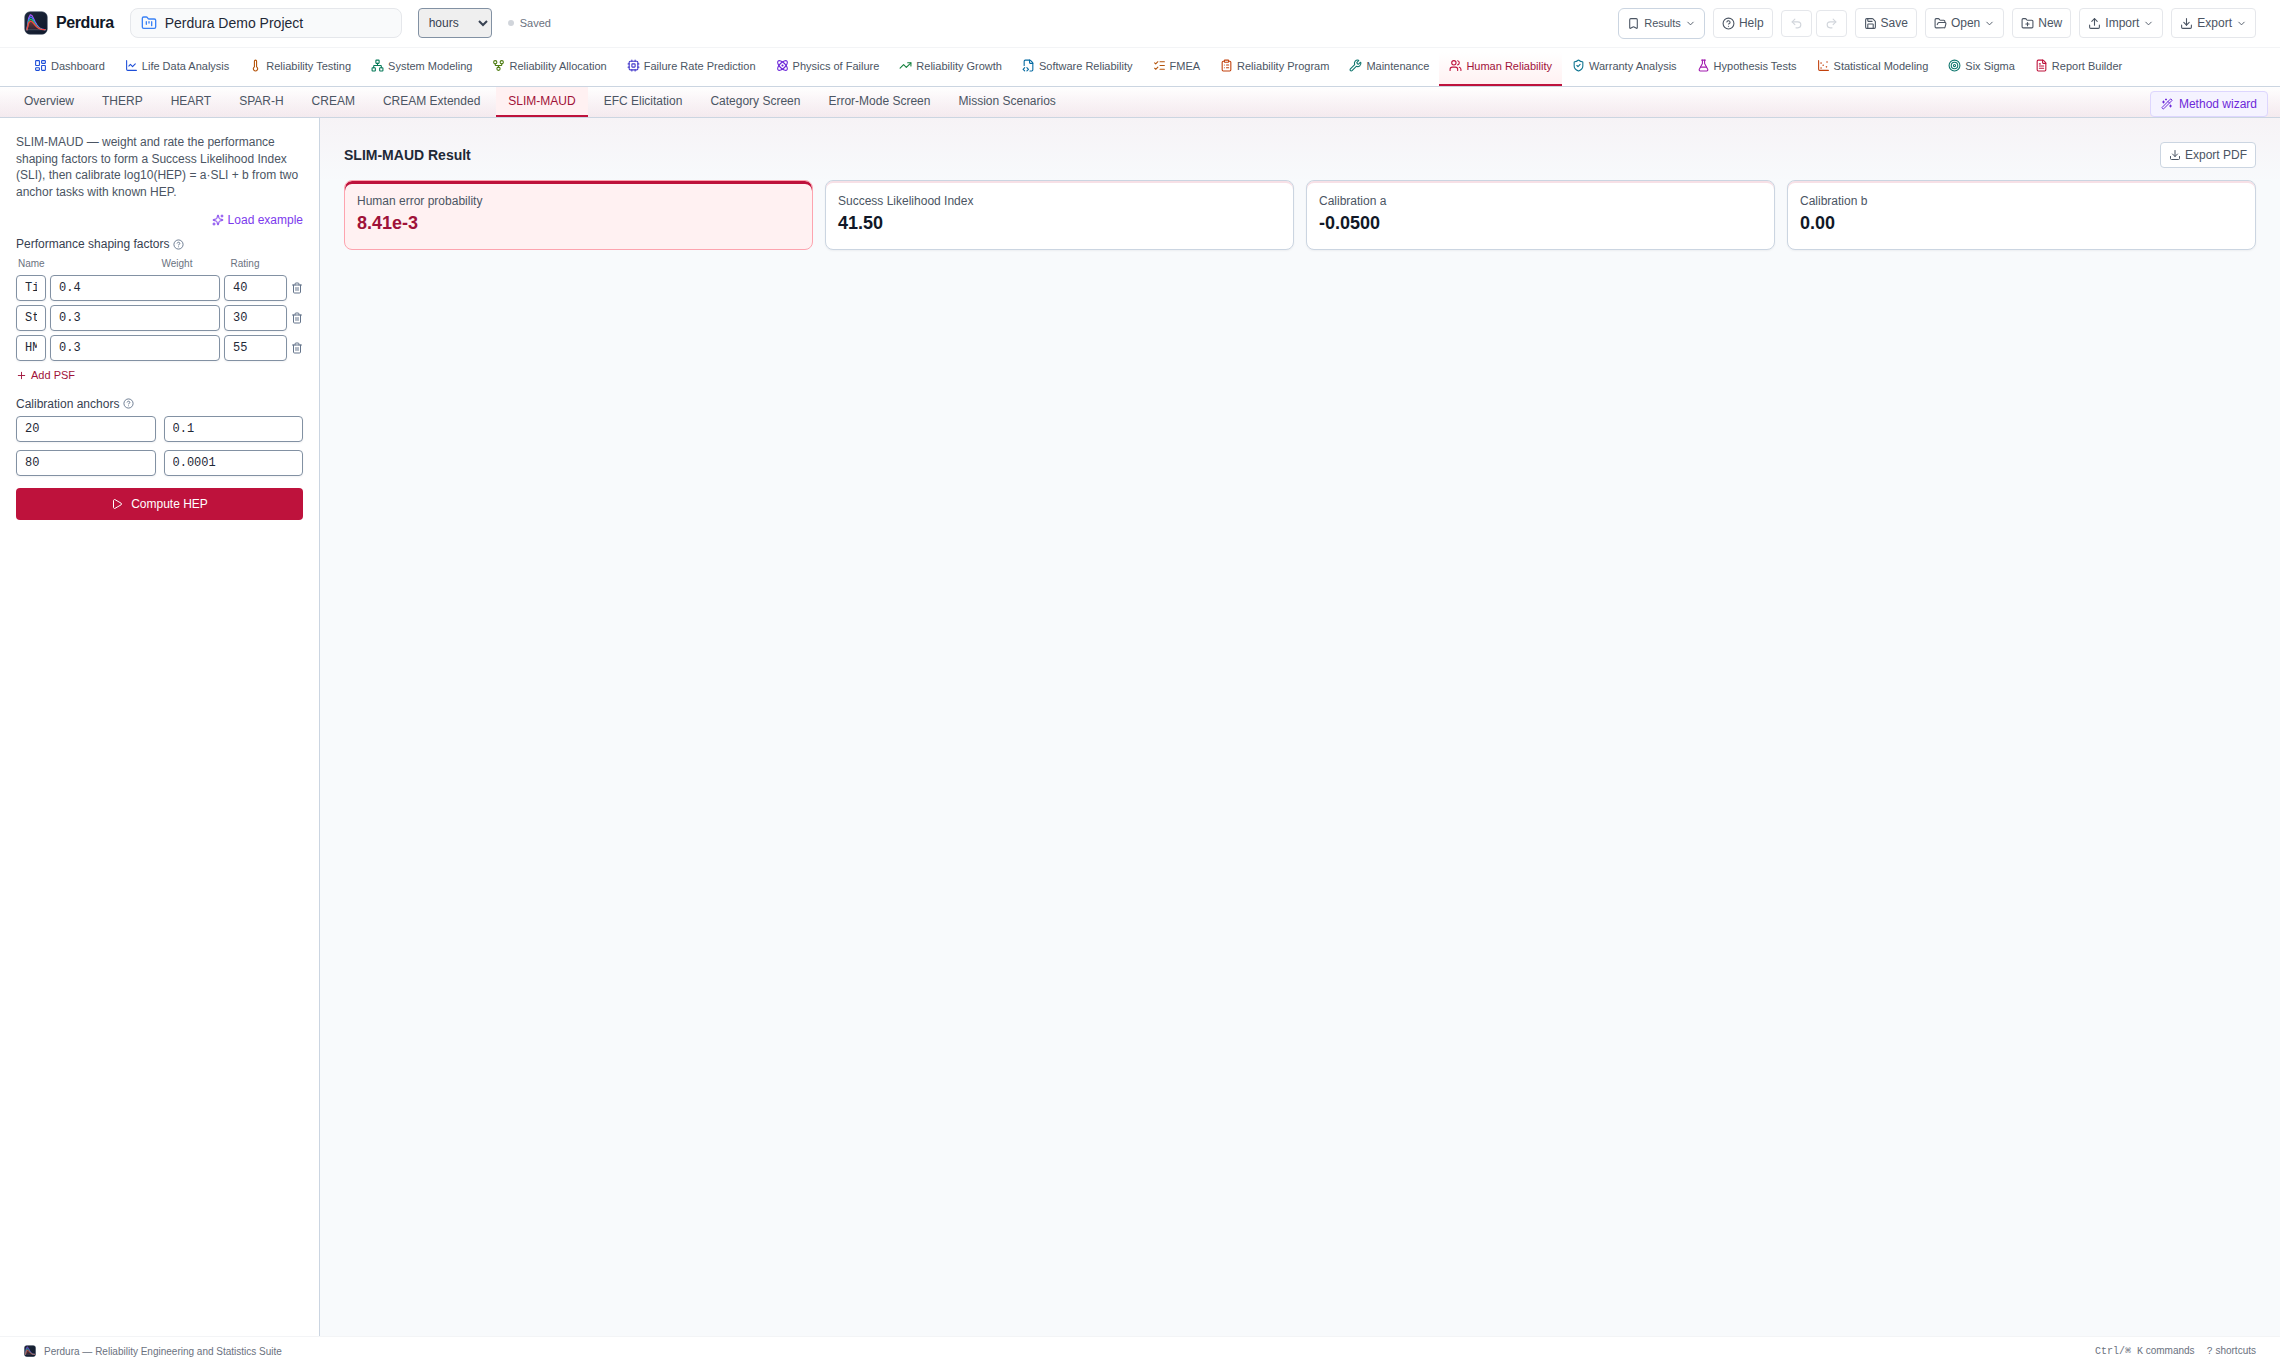
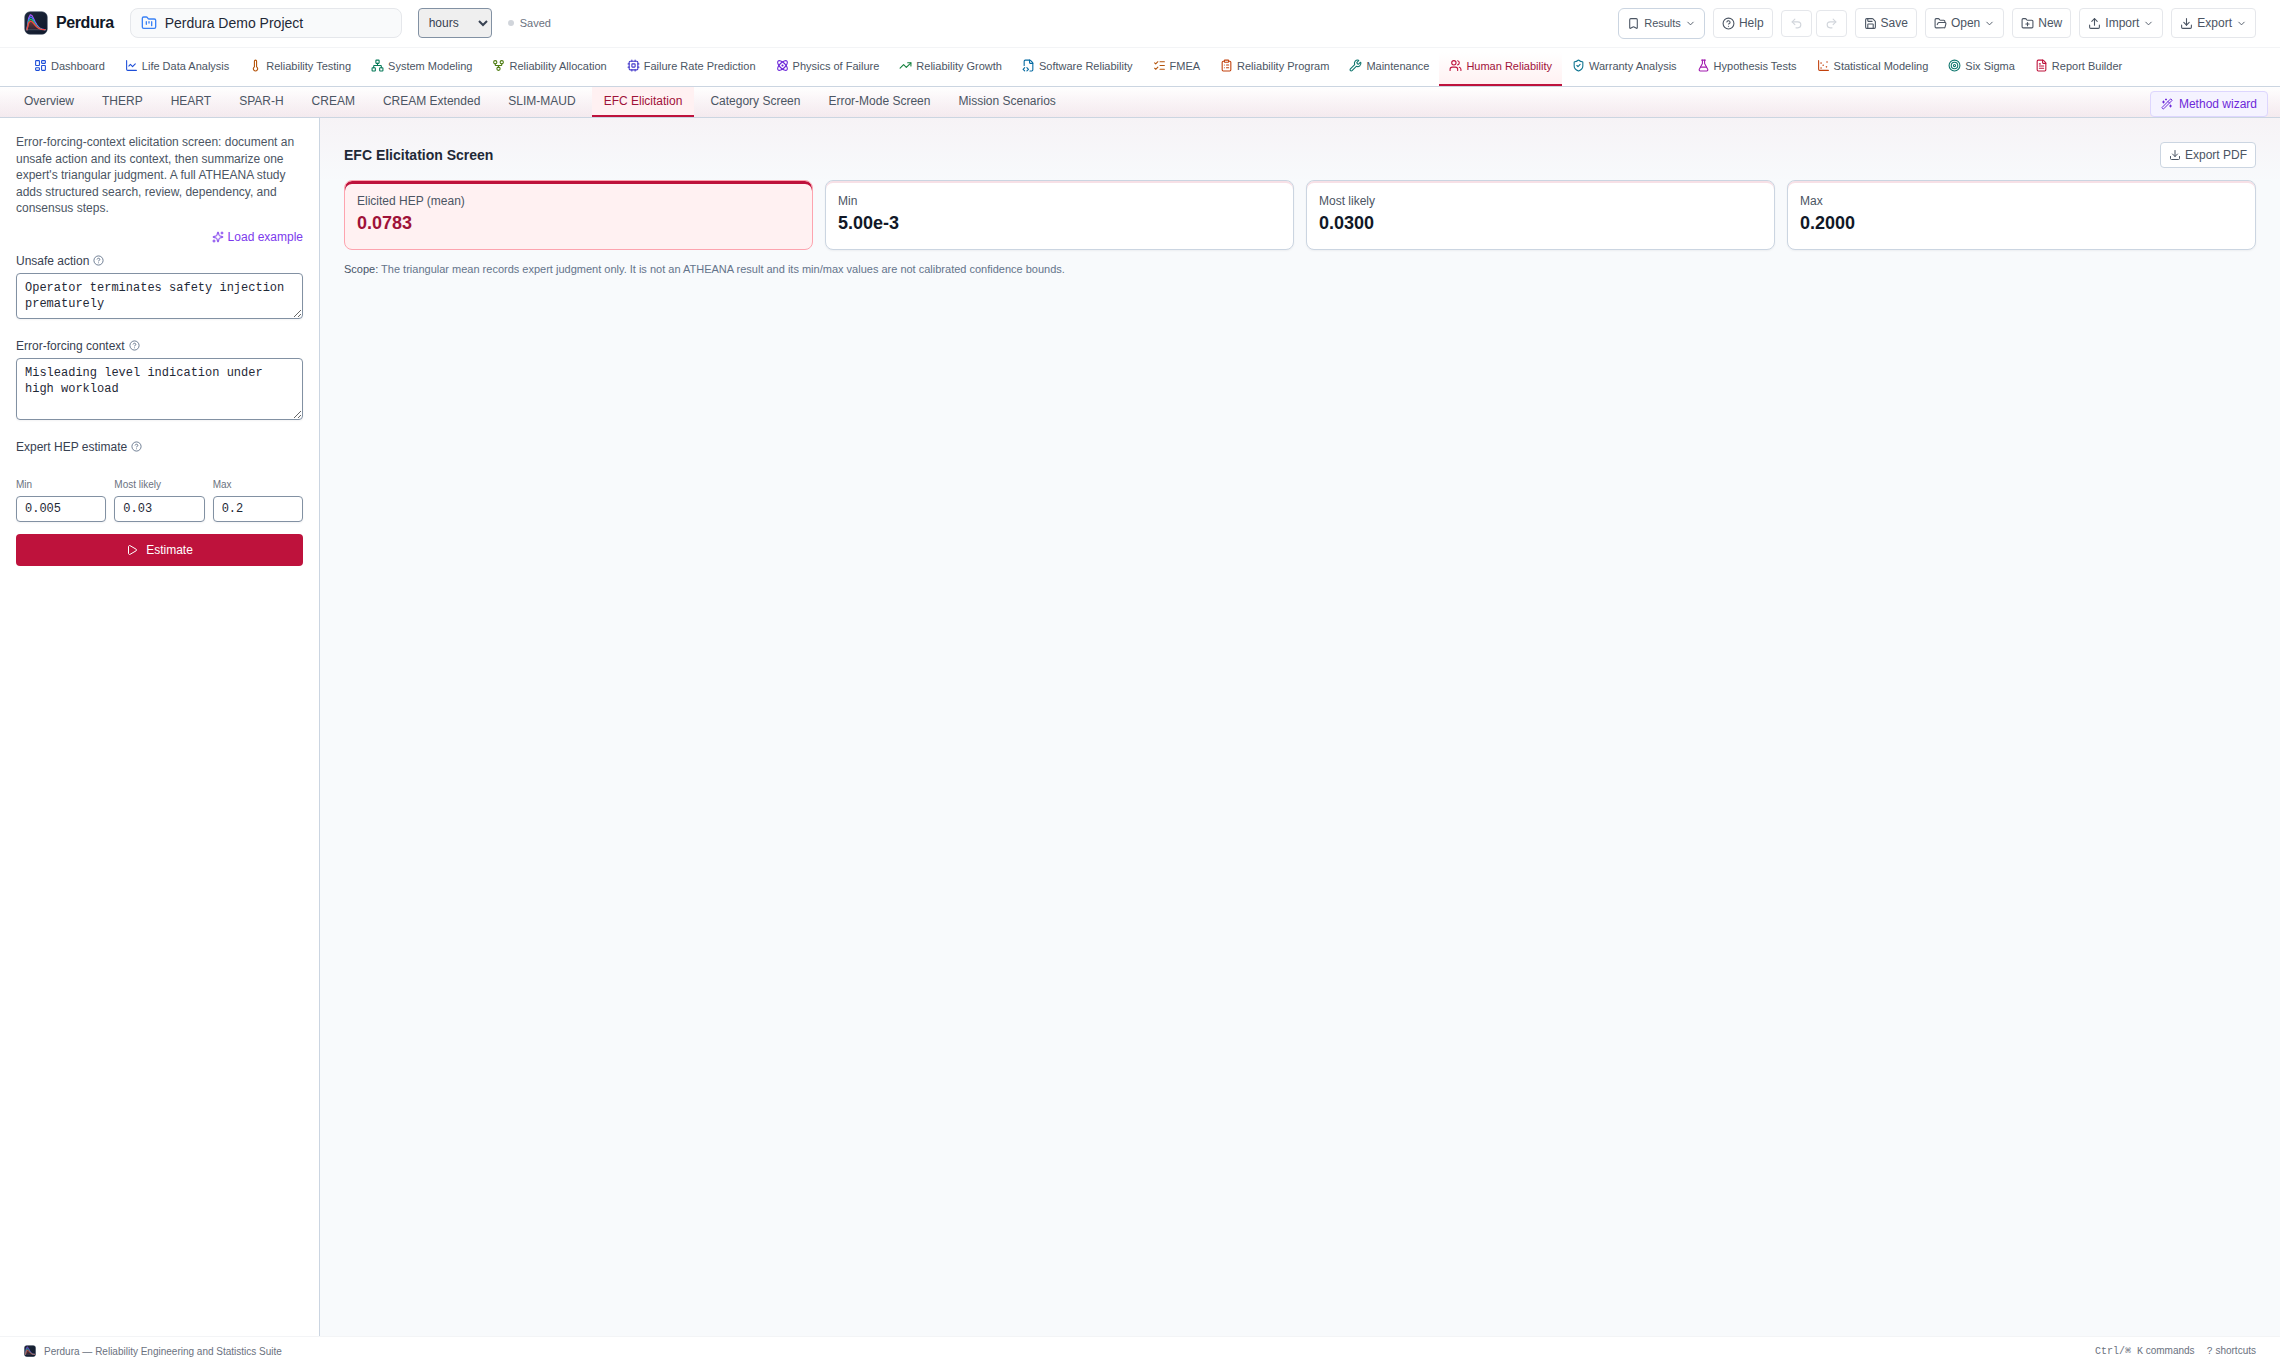
Use the arrows, arrow keys, or swipe to review each analysis. Open an image for full resolution.
Reliability Allocation
Apportion system reliability or MTBF requirements across subsystems and assess target compliance.
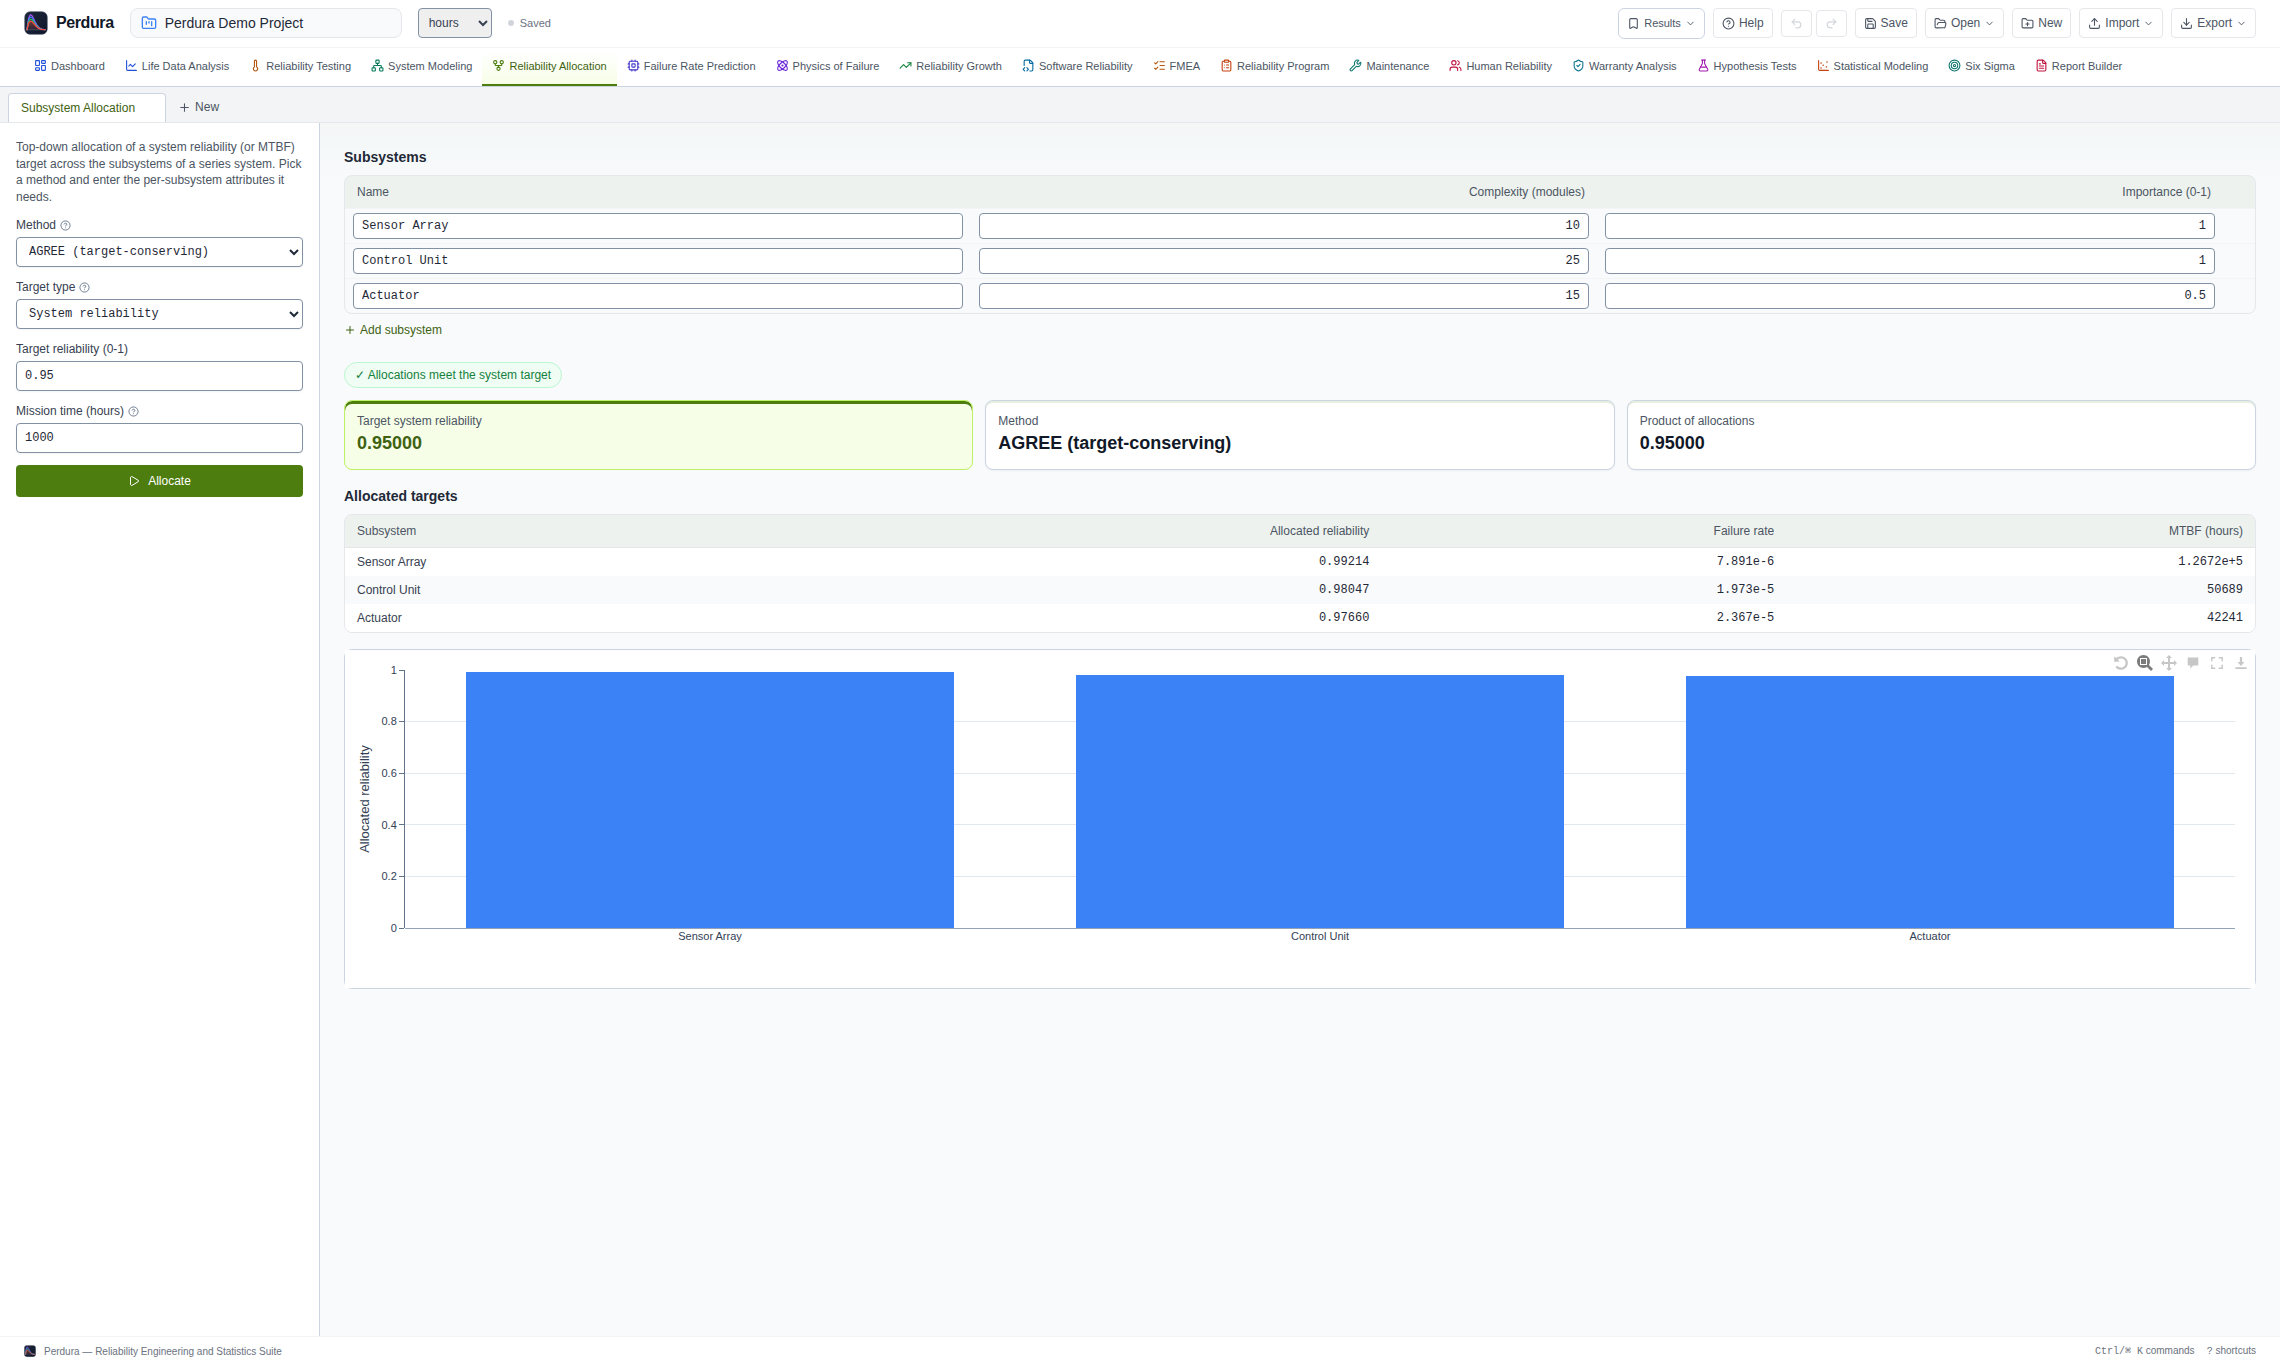
- Top-down reliability-requirement apportionment across series subsystems
- Equal, ARINC, AGREE and Feasibility-of-effort methods
- BOM and predicted failure-rate import from the reliability-prediction folio
- Allocated-versus-achieved reliability comparison with target-status indication
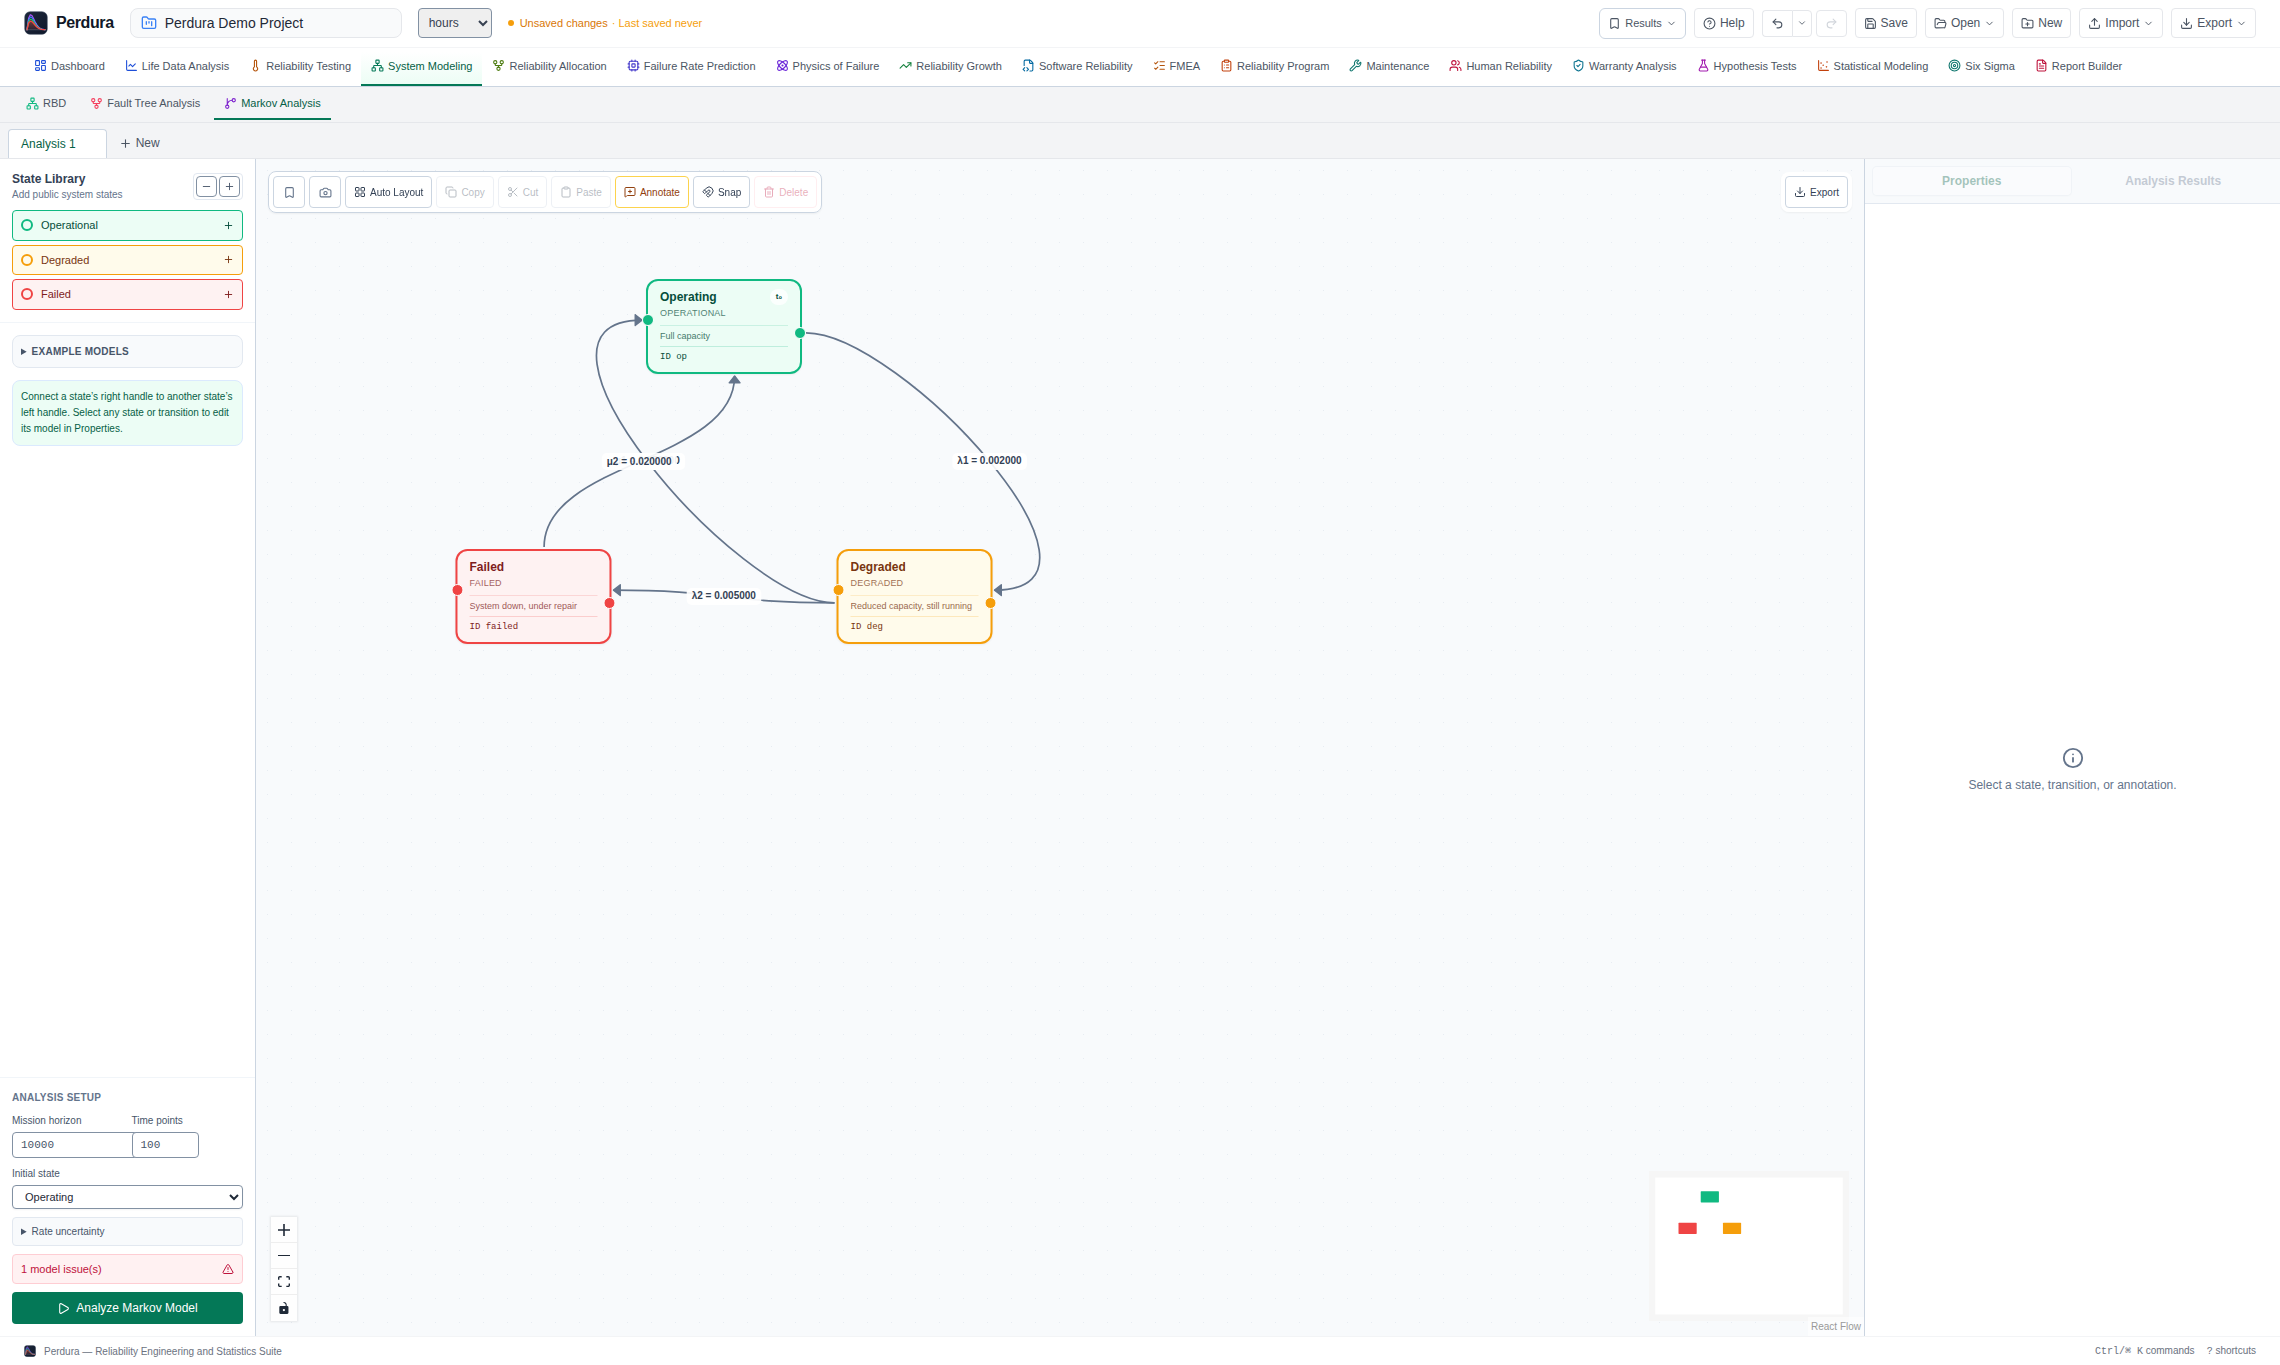
Markov Models (State-Space)
Model repairable systems, steady-state availability and time-dependent state probabilities with CTMCs.
- Continuous-time Markov chain (CTMC) models defined by system states and transition rates
- Steady-state availability, MTBF, MTTF, mean up time and MTTR
- Time-dependent state-probability evolution
- Transition rates linked to fitted life-data distributions
Physics of Failure
Apply stress–life and failure-mechanism models to fatigue, creep, fracture and electronic wear-out.
- S–N (Basquin), Ramberg–Osgood, Larson–Miller creep and Miner’s cumulative-damage rule
- Linear-elastic fracture mechanics with Paris-law crack growth
- Coffin–Manson strain–life and Norris–Landzberg solder-fatigue models
- Black’s equation, Peck’s model and Arrhenius acceleration for electronic failure mechanisms
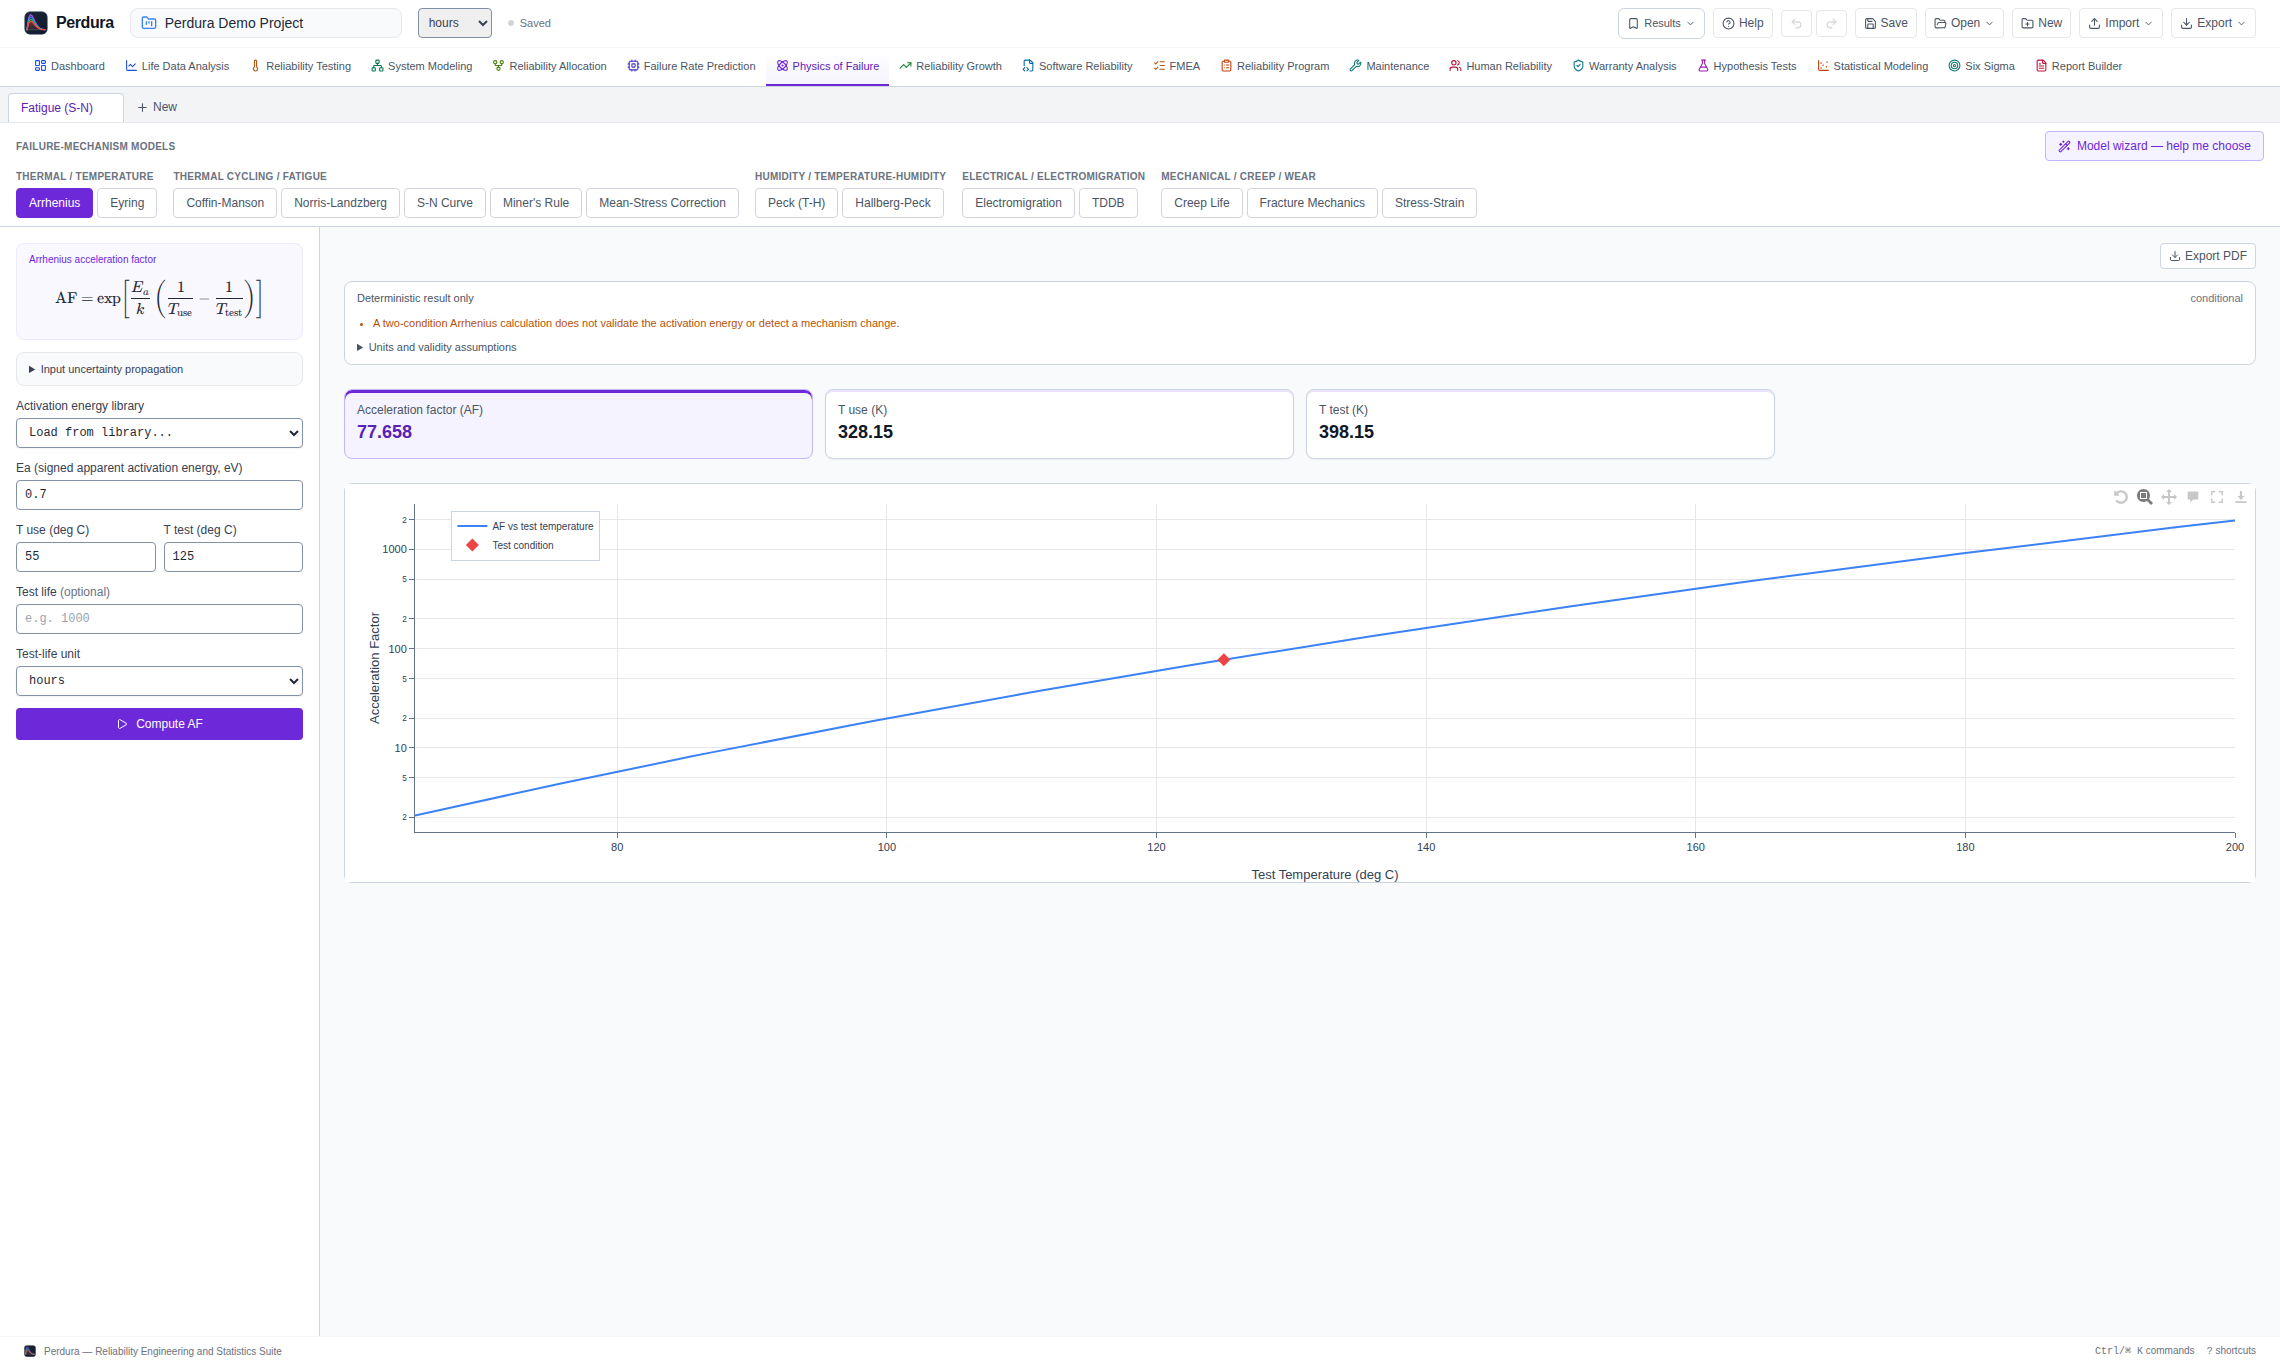
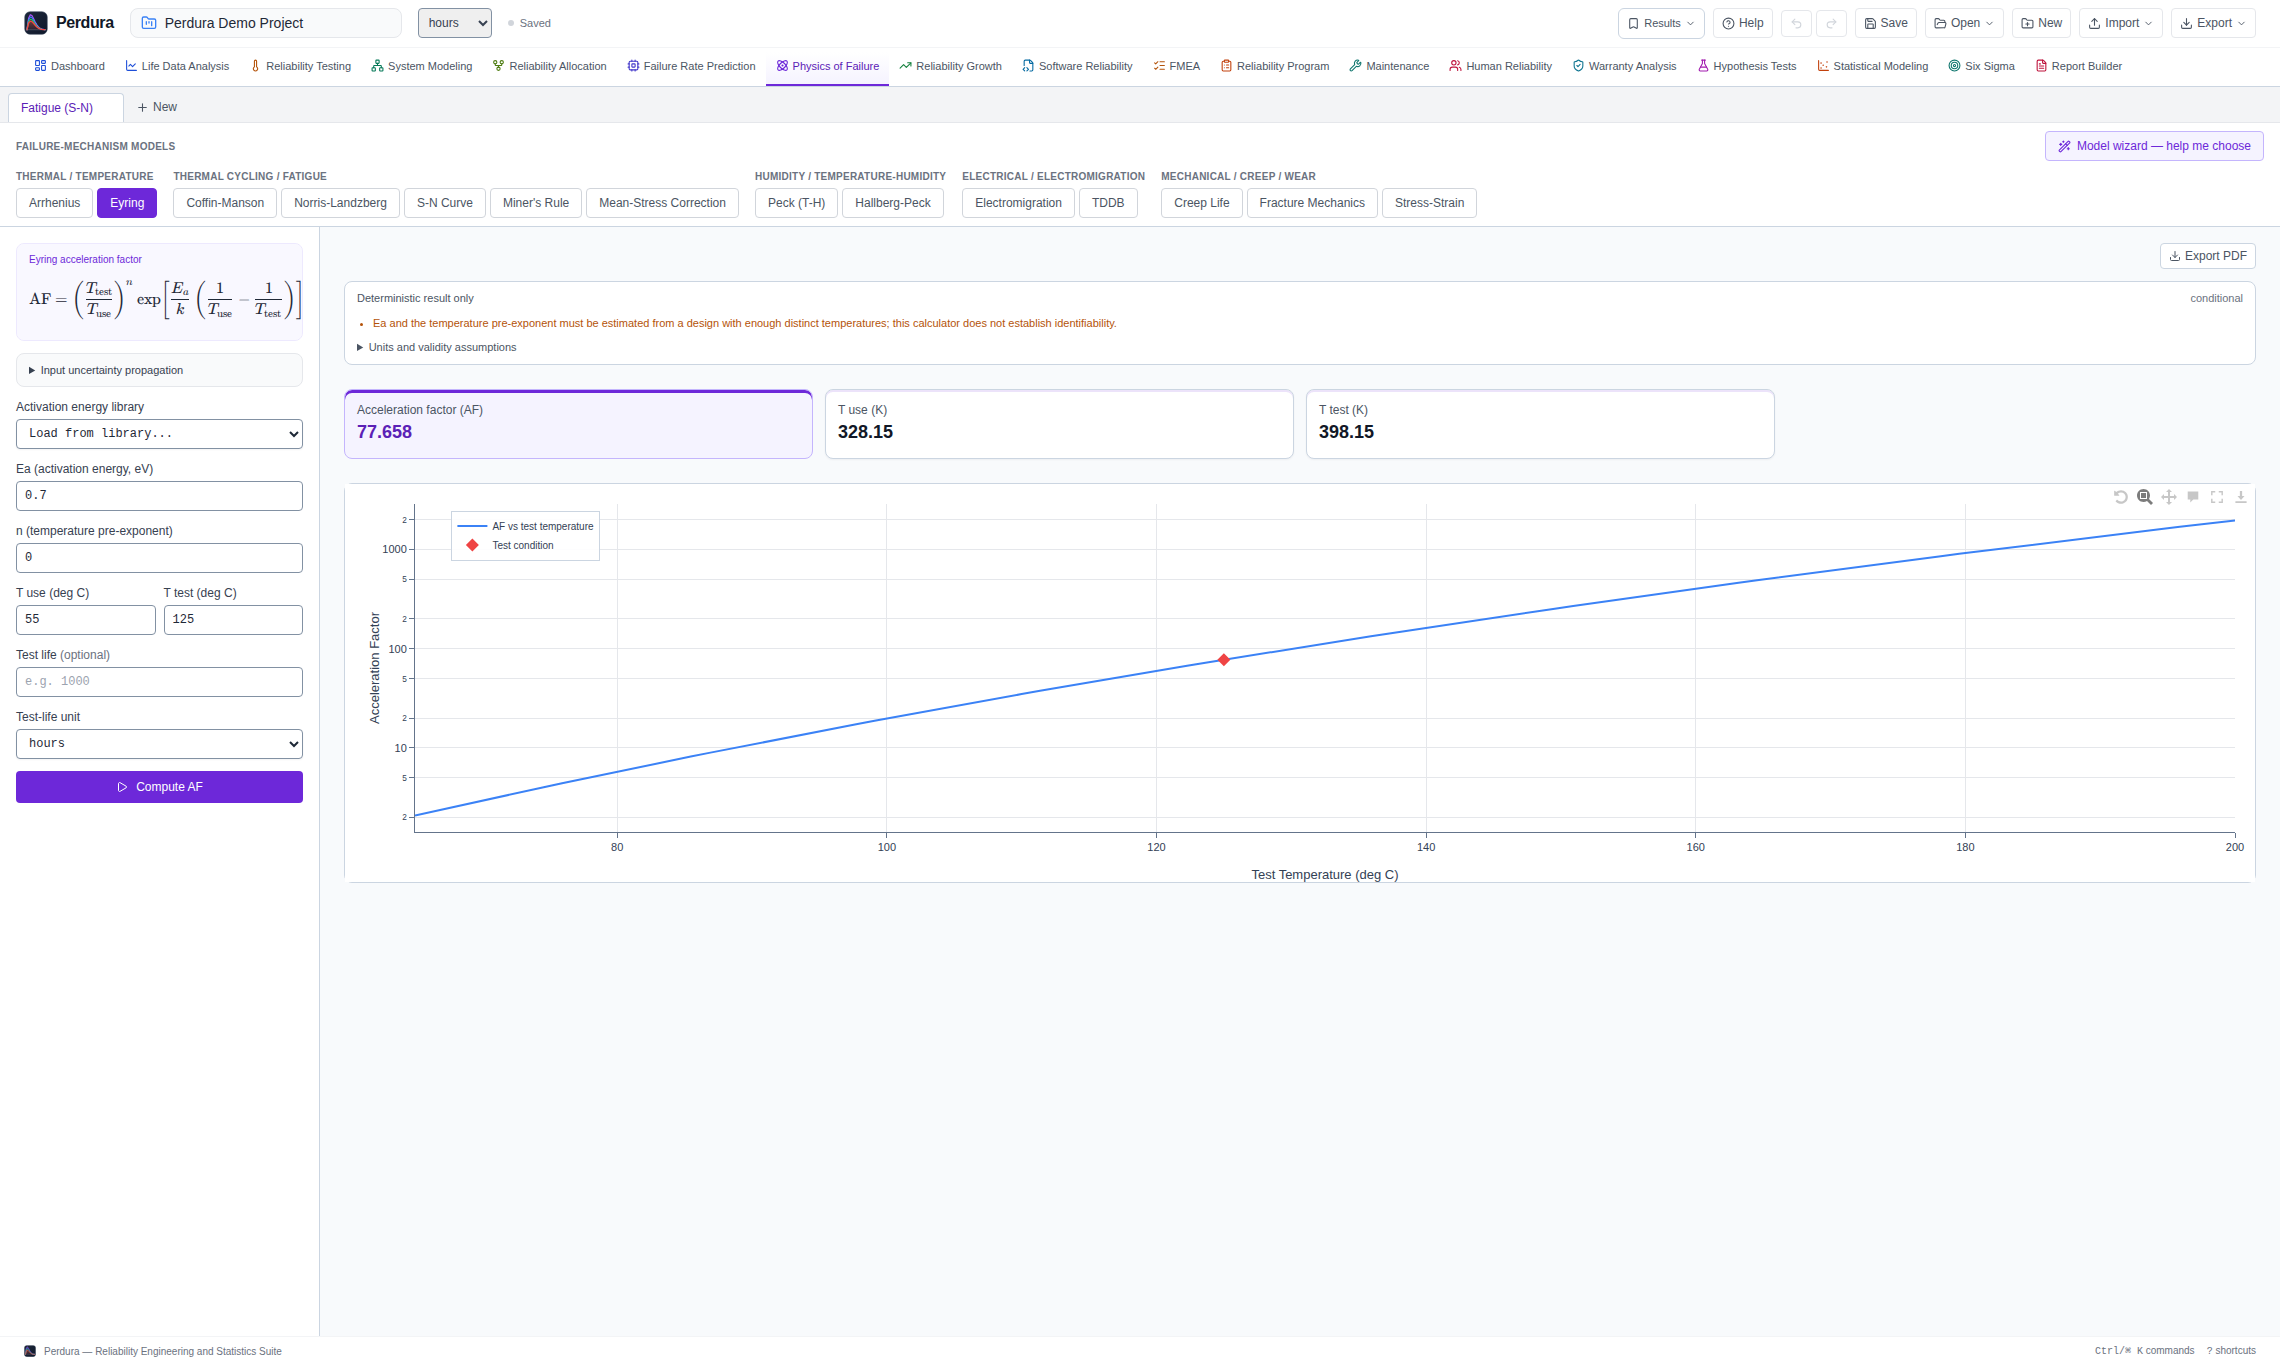
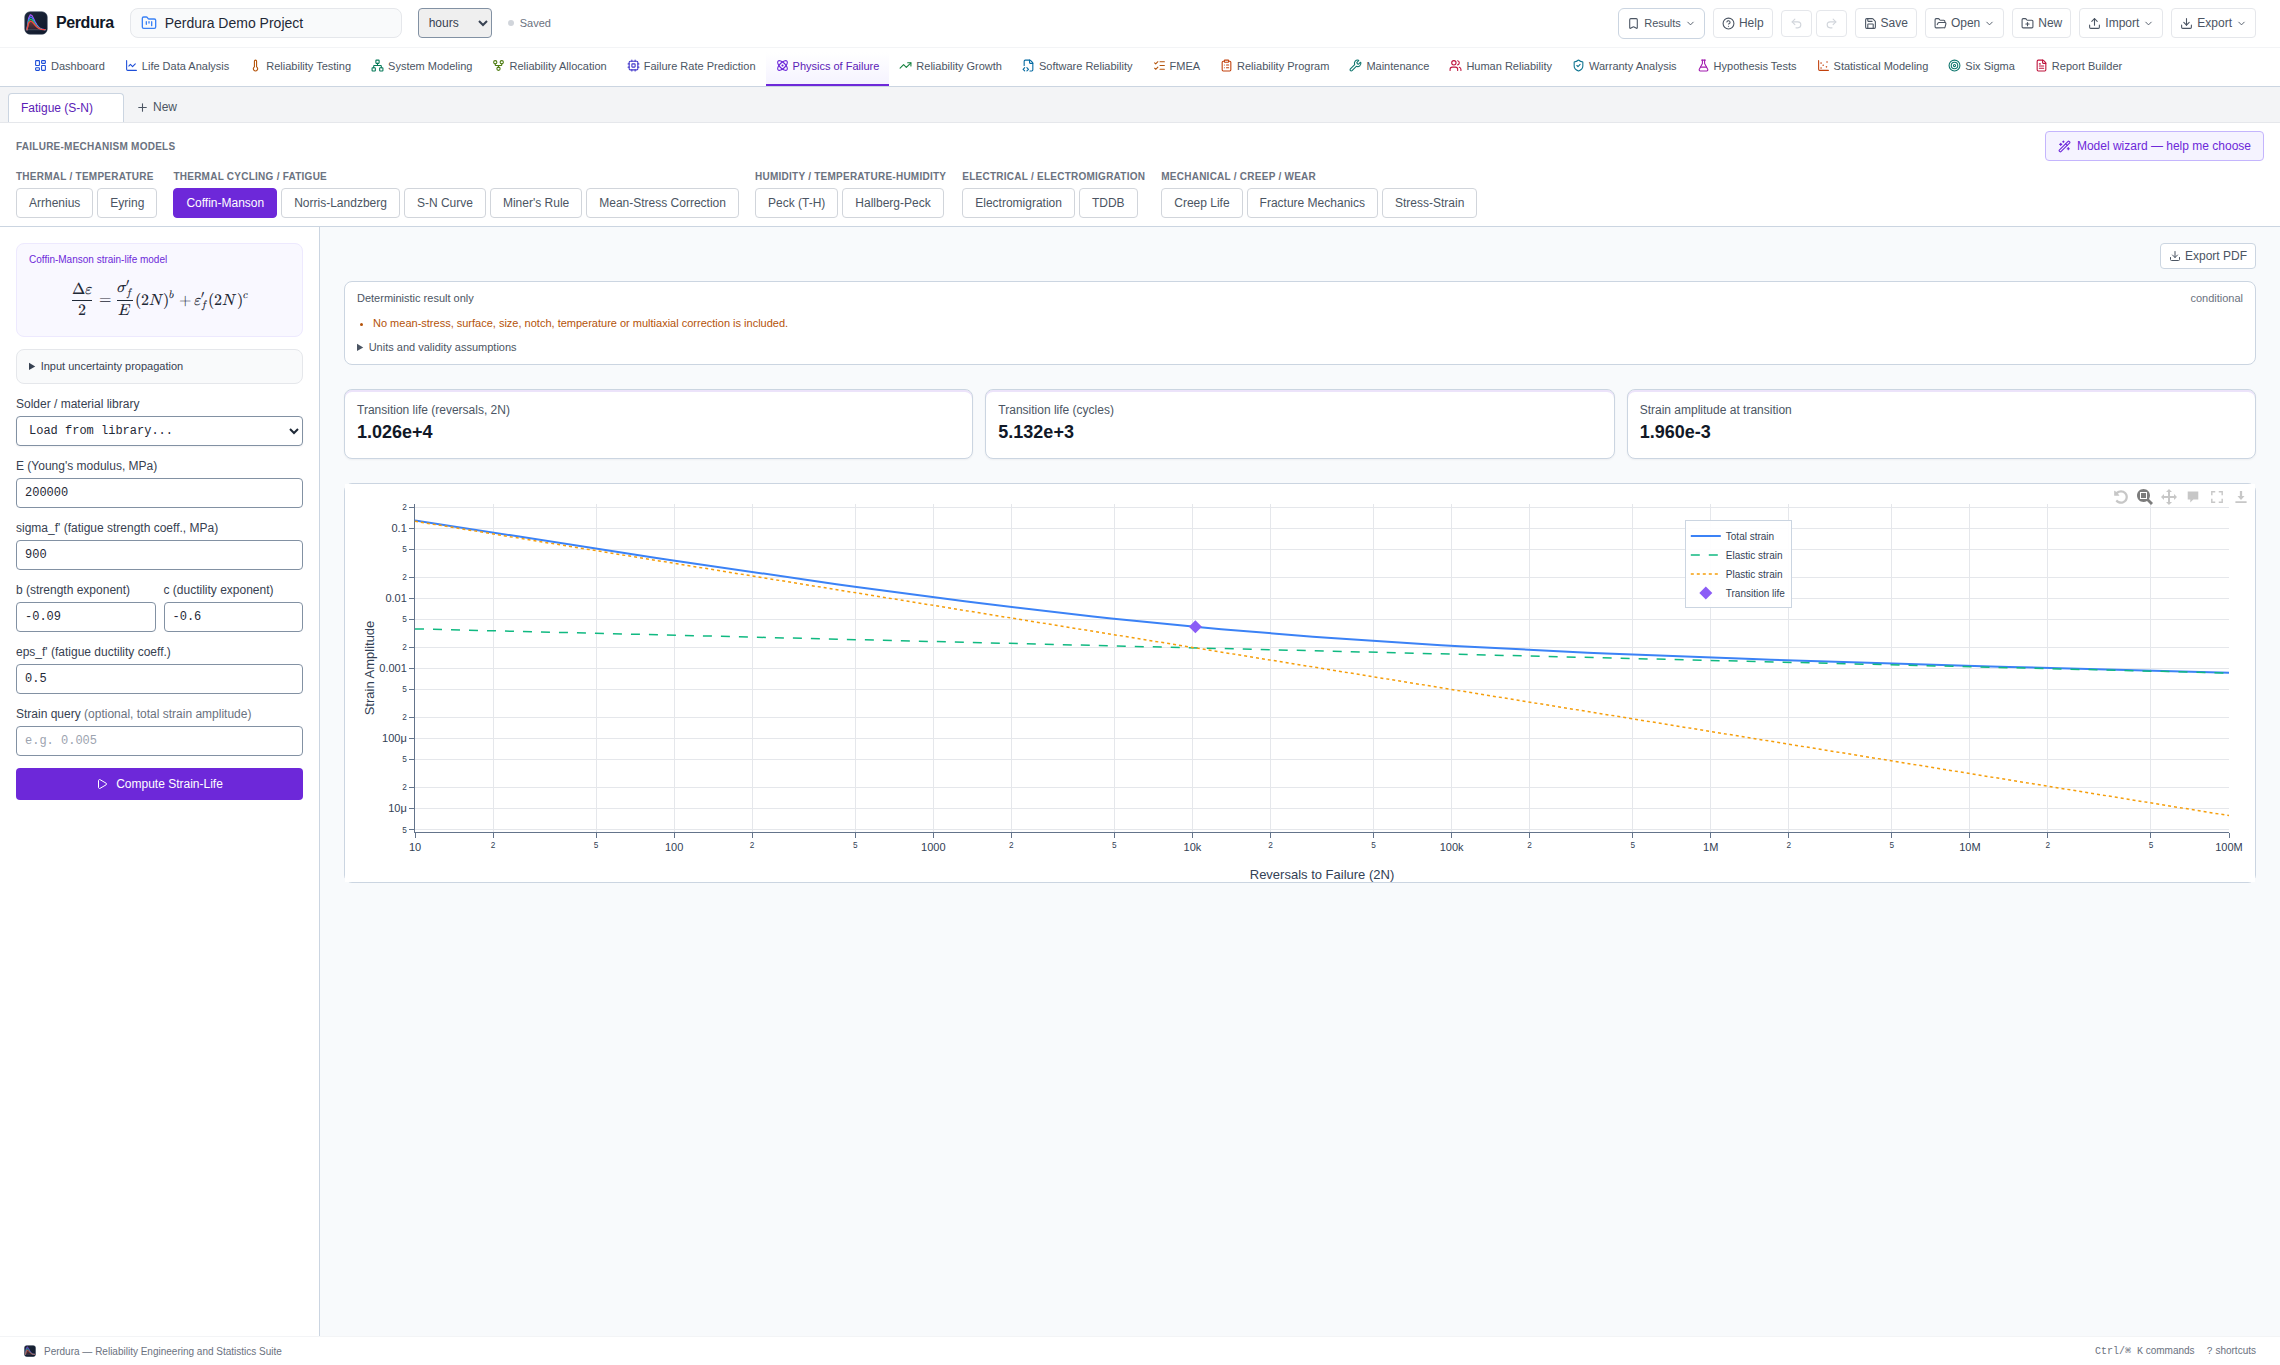
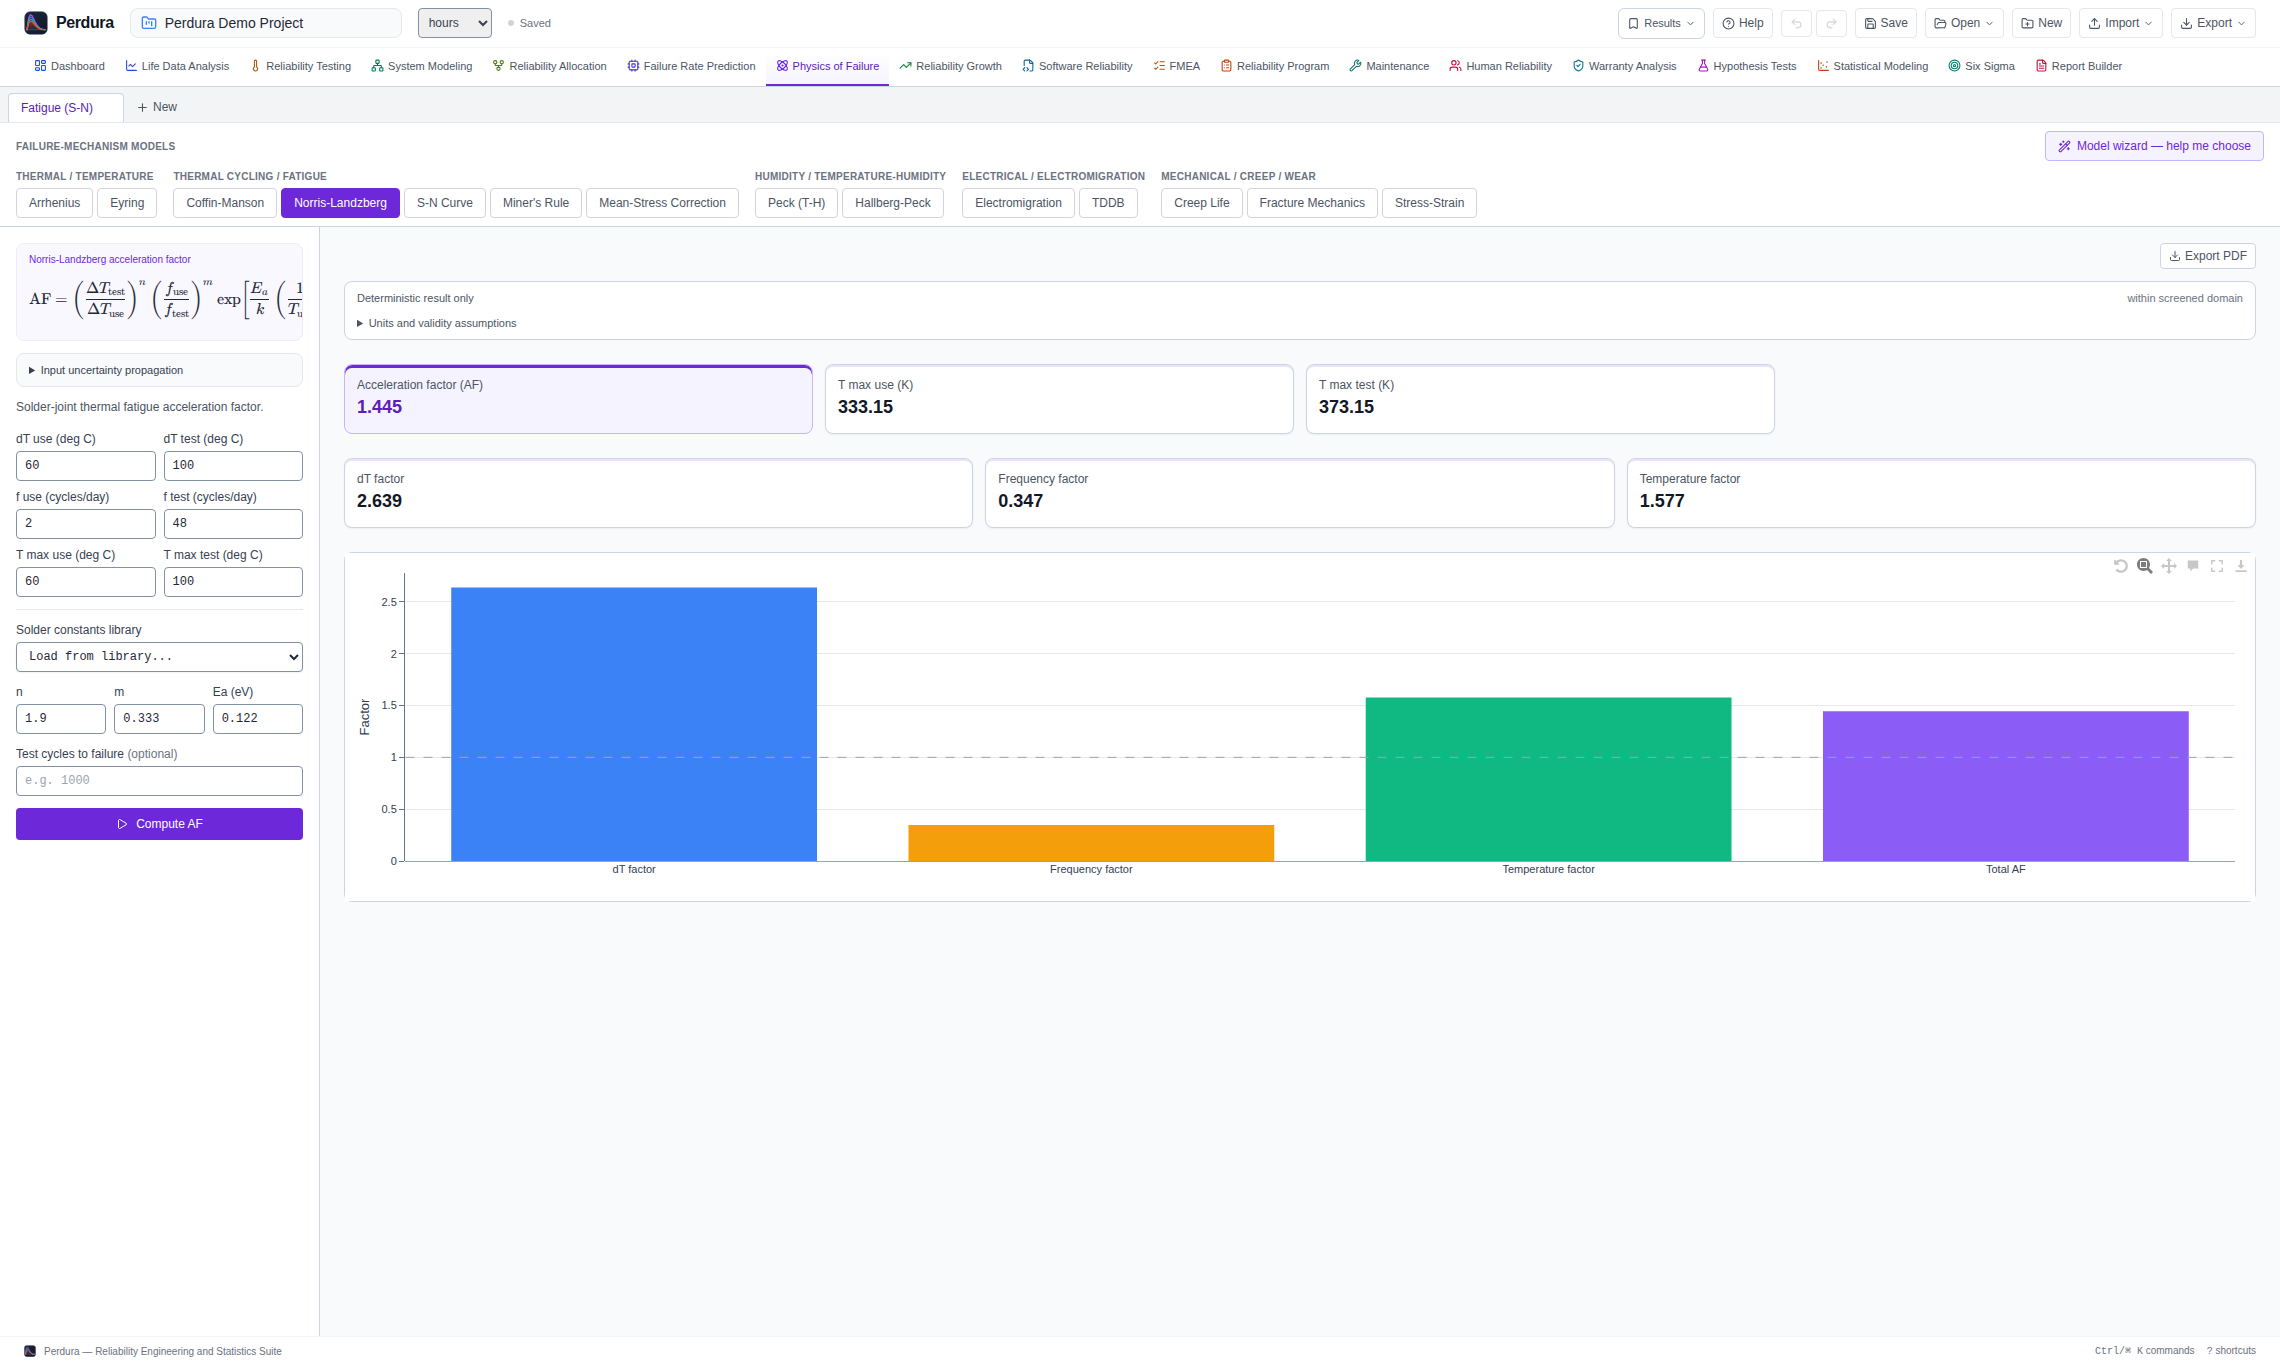
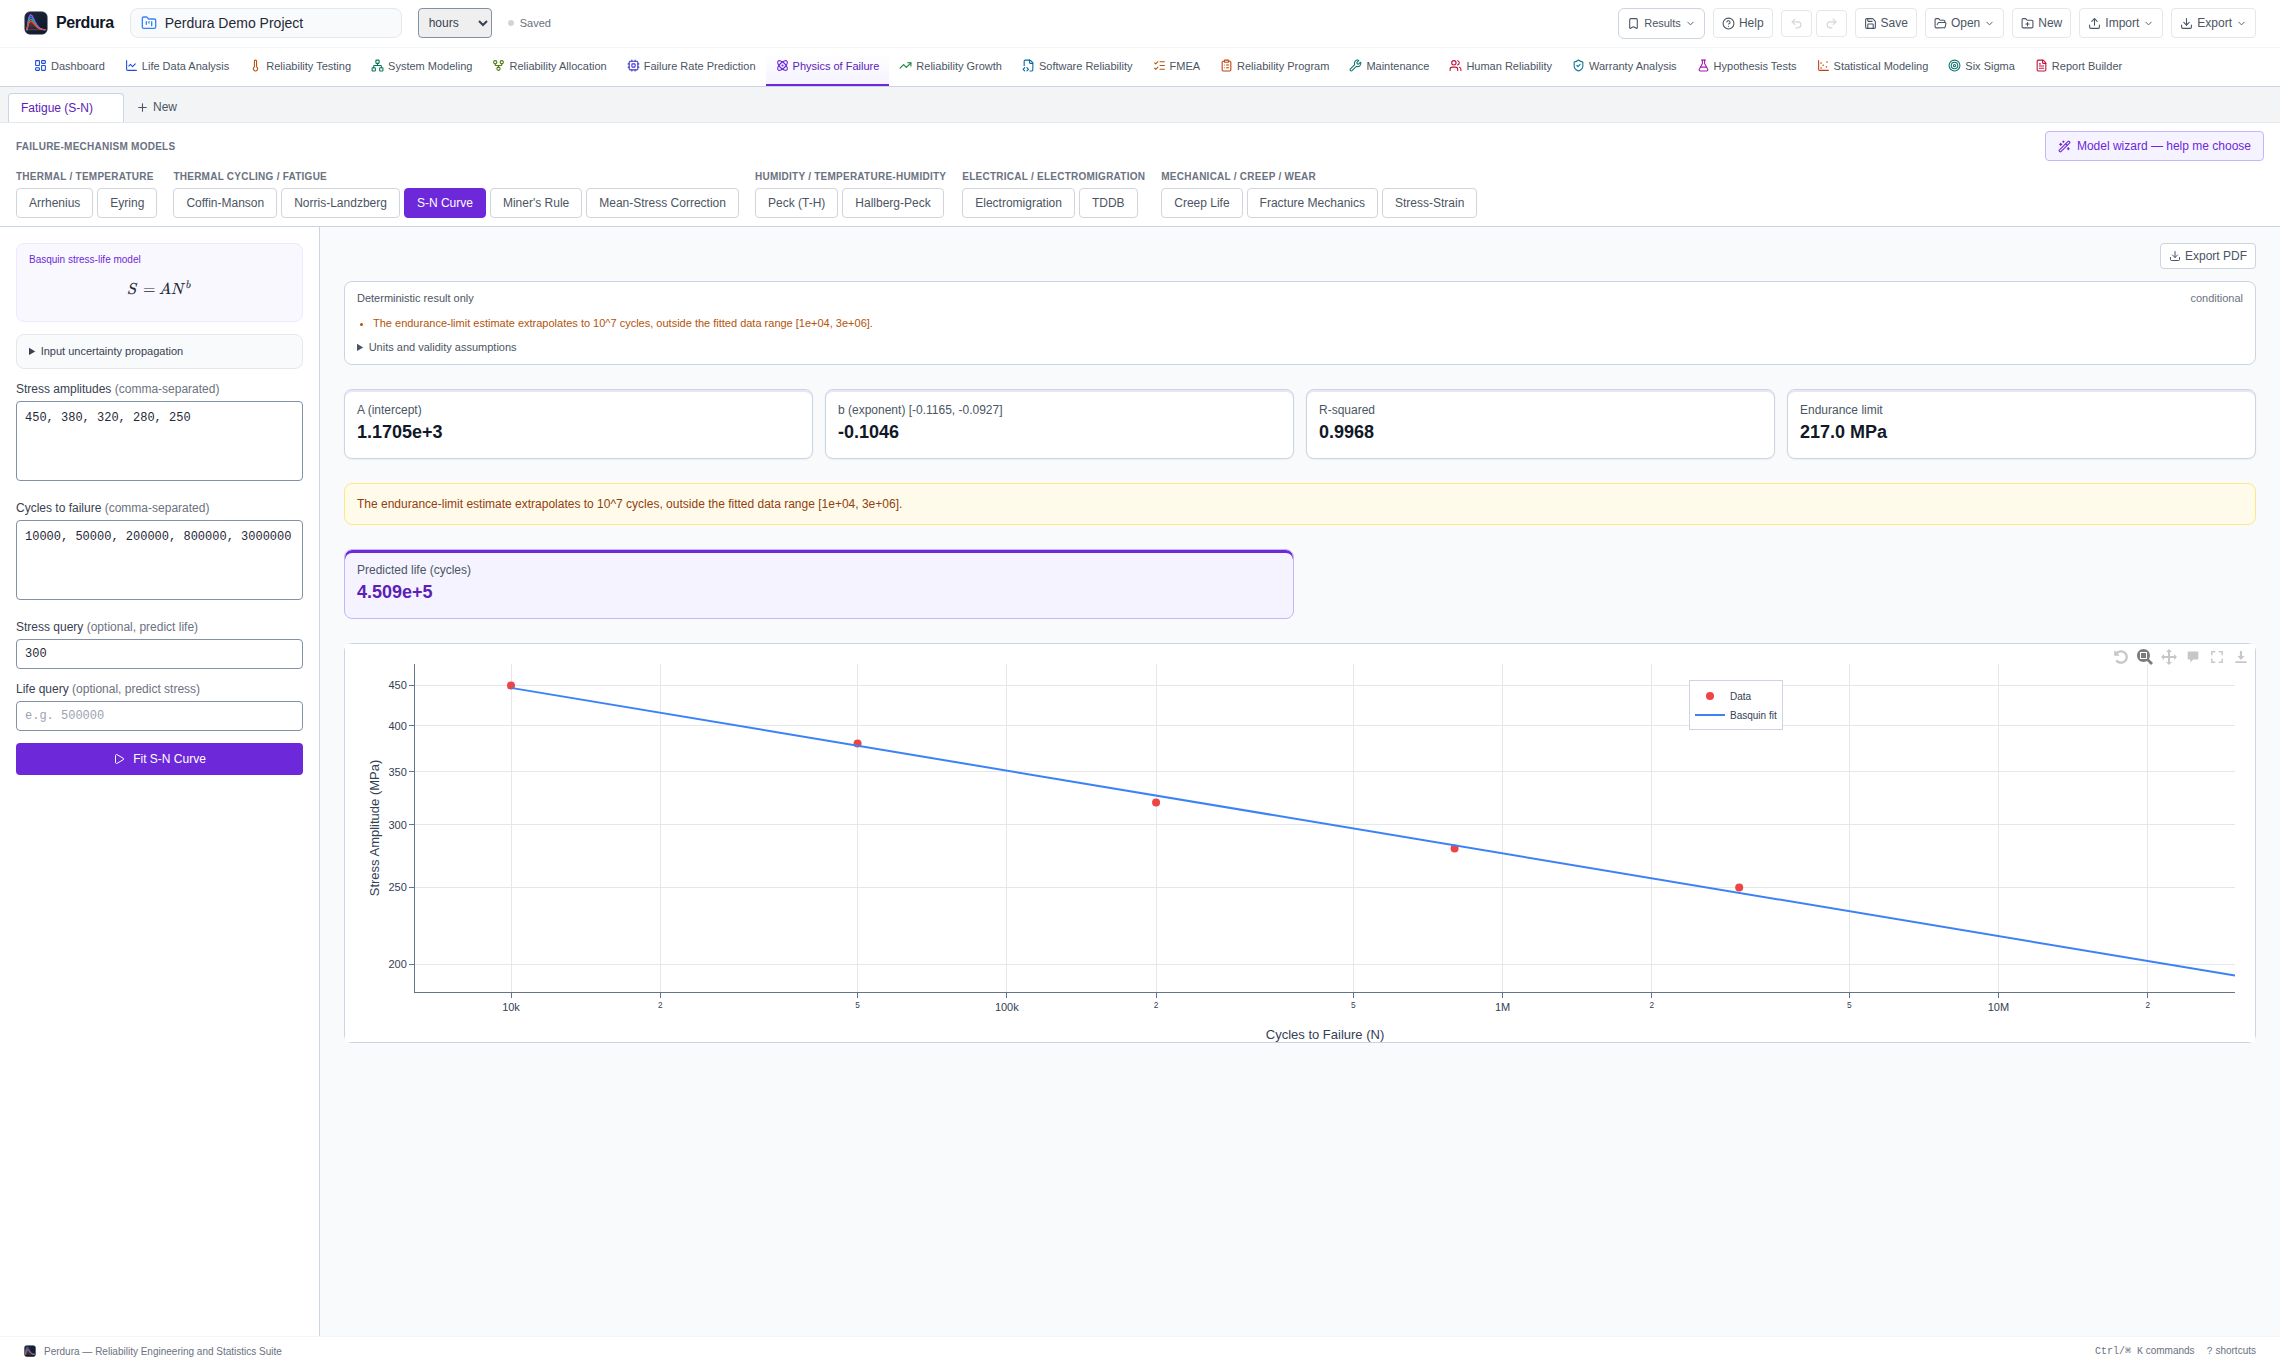
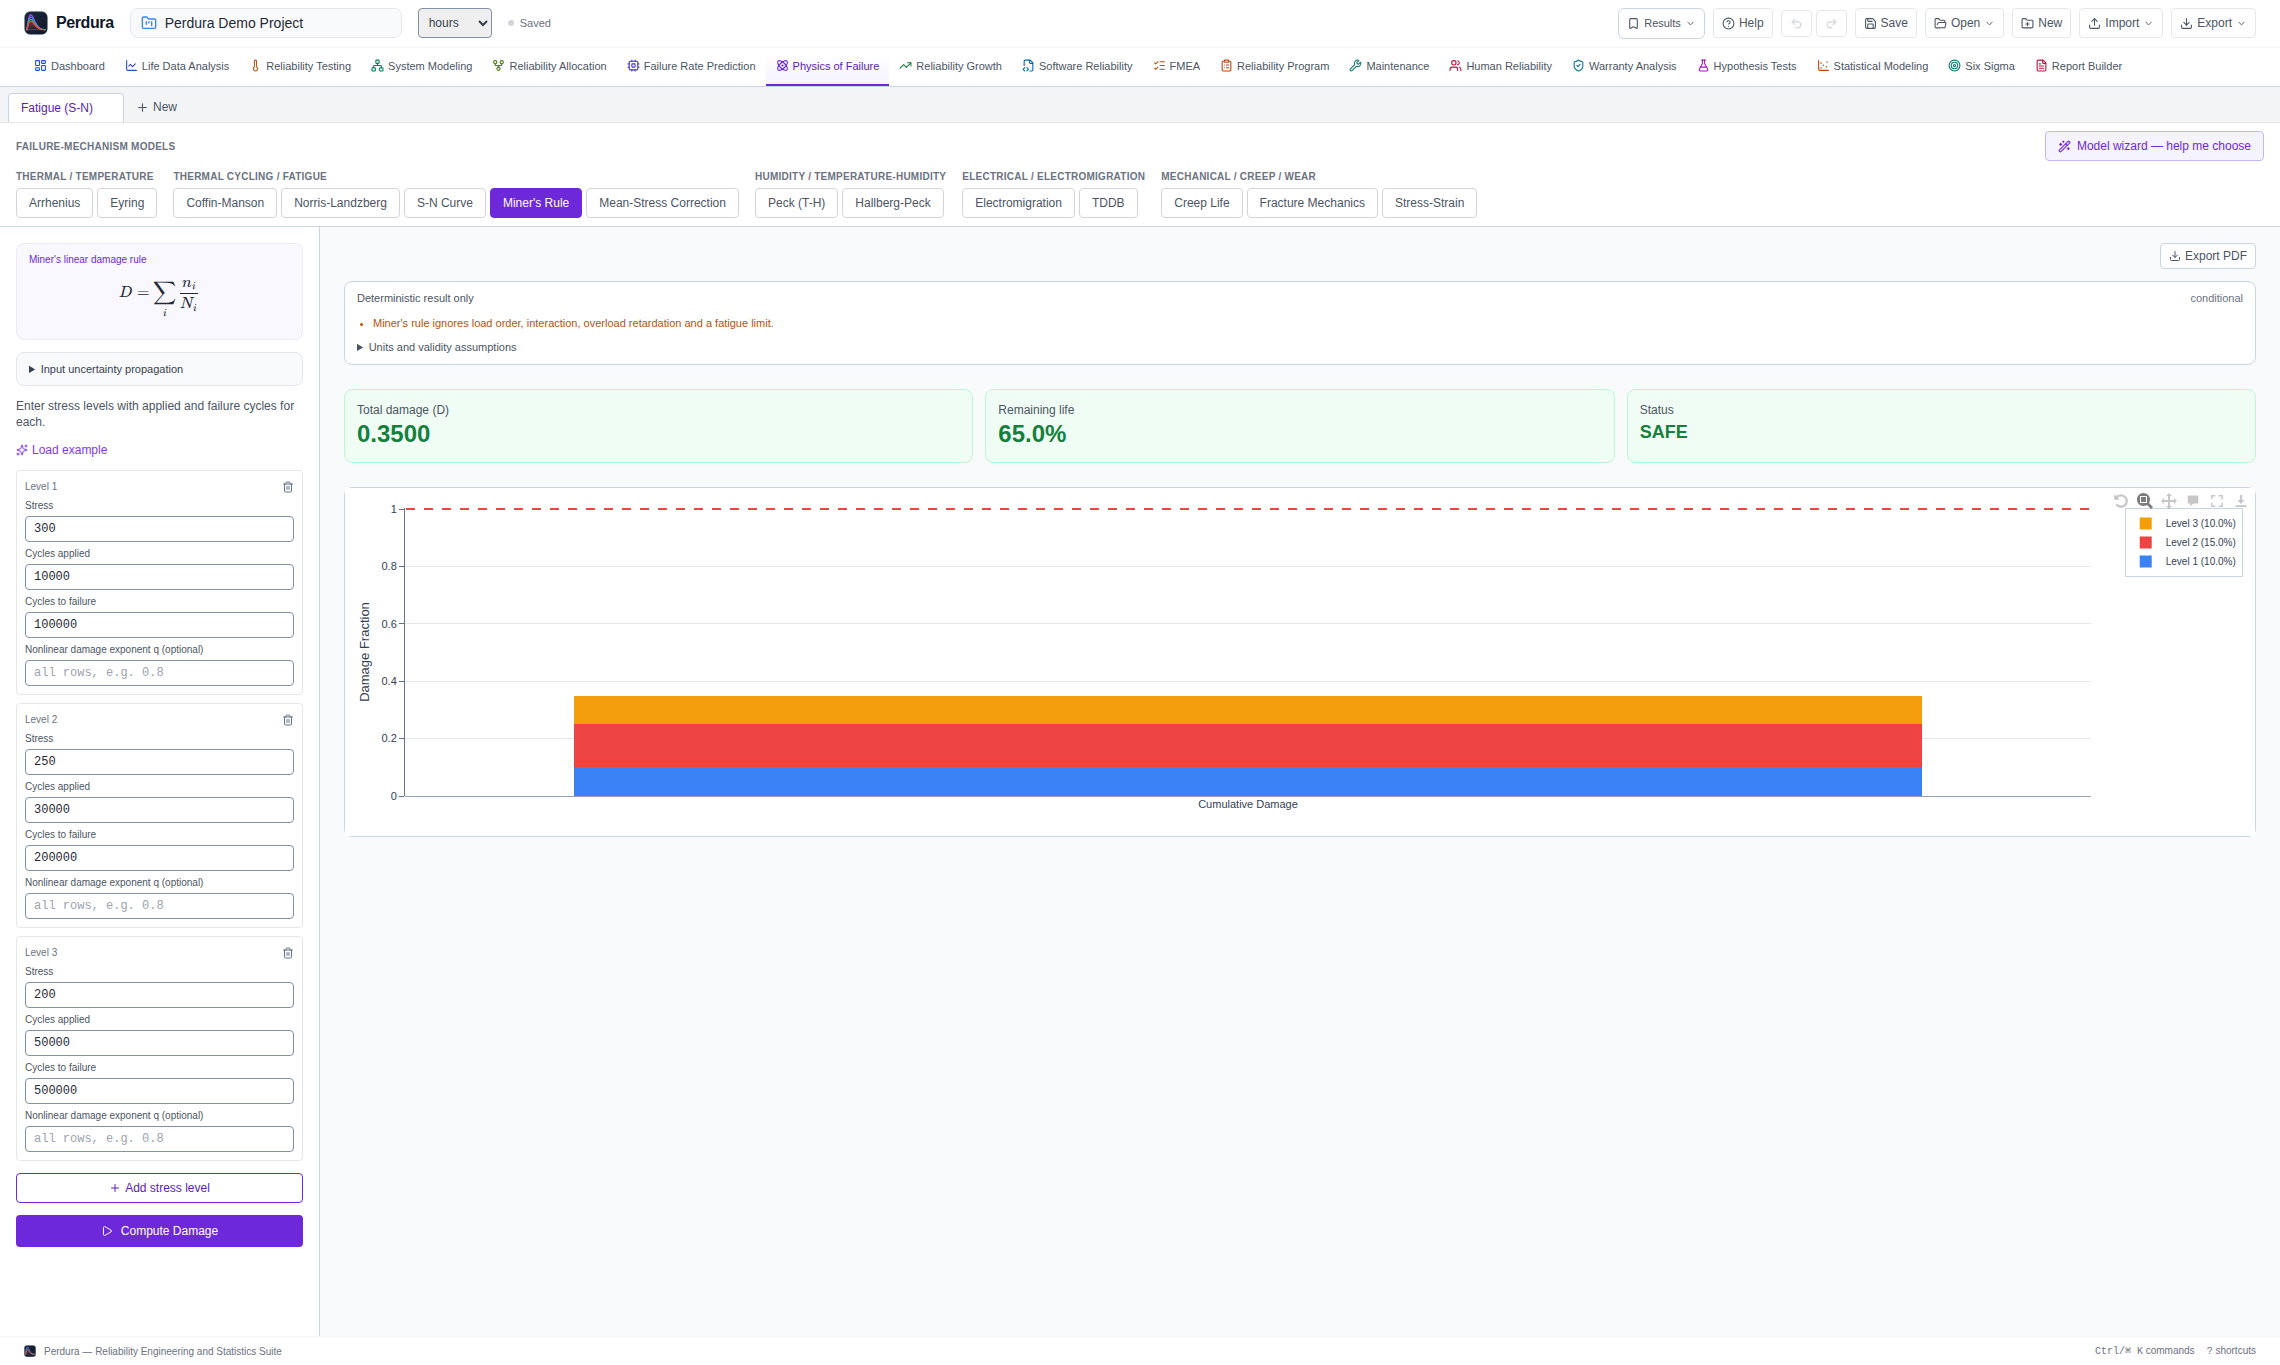
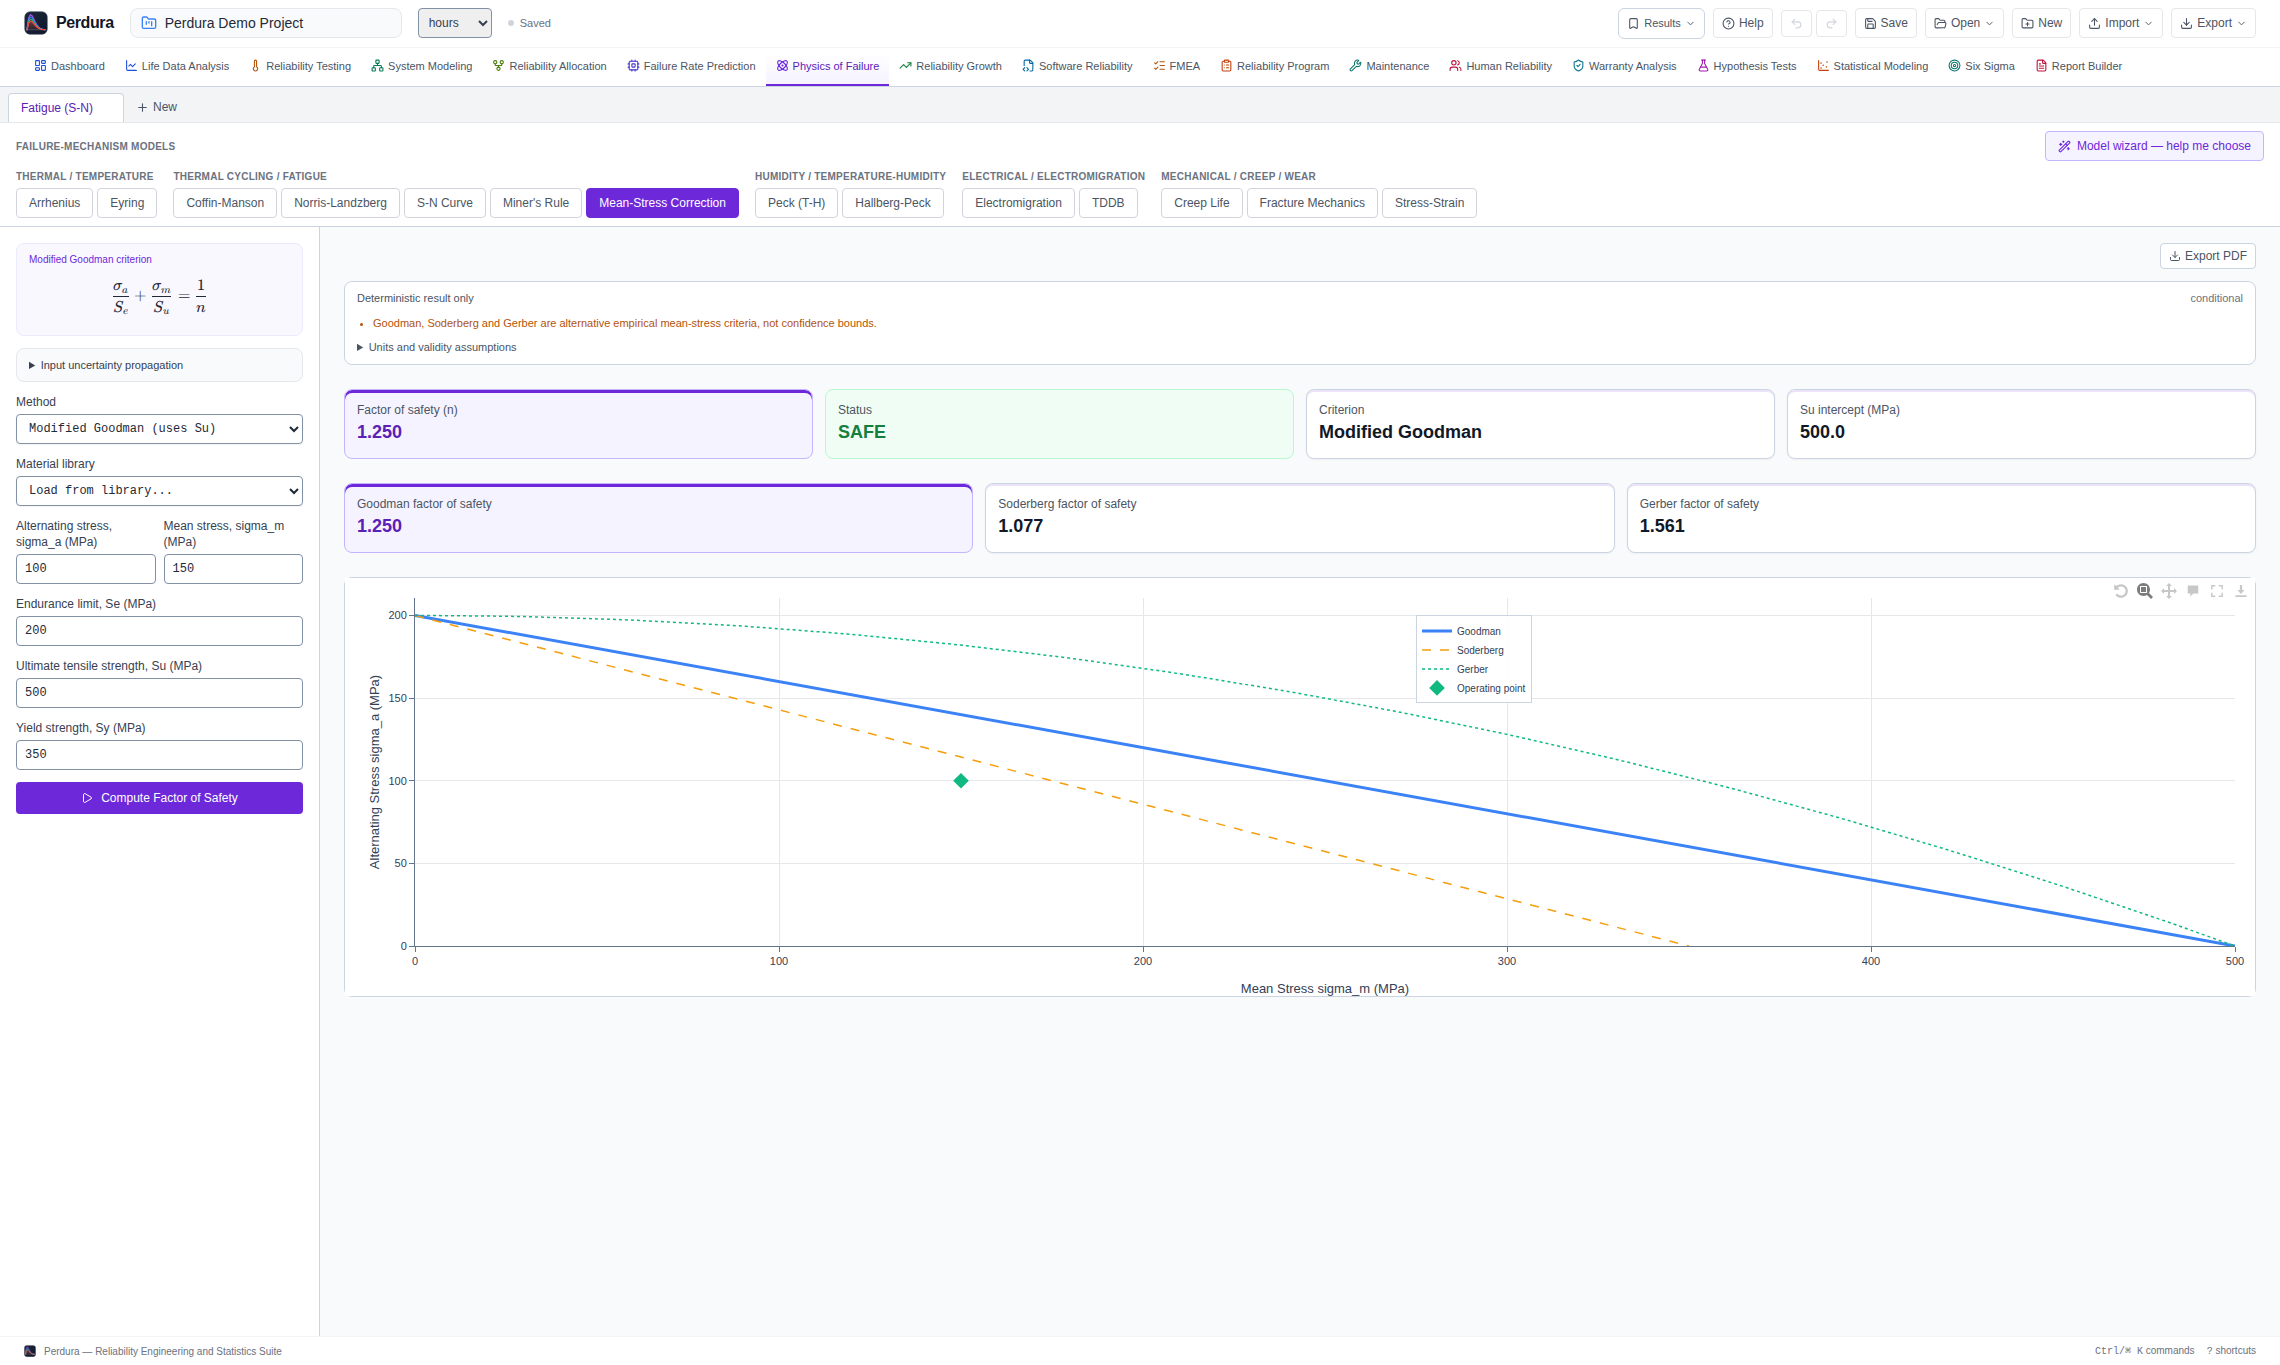
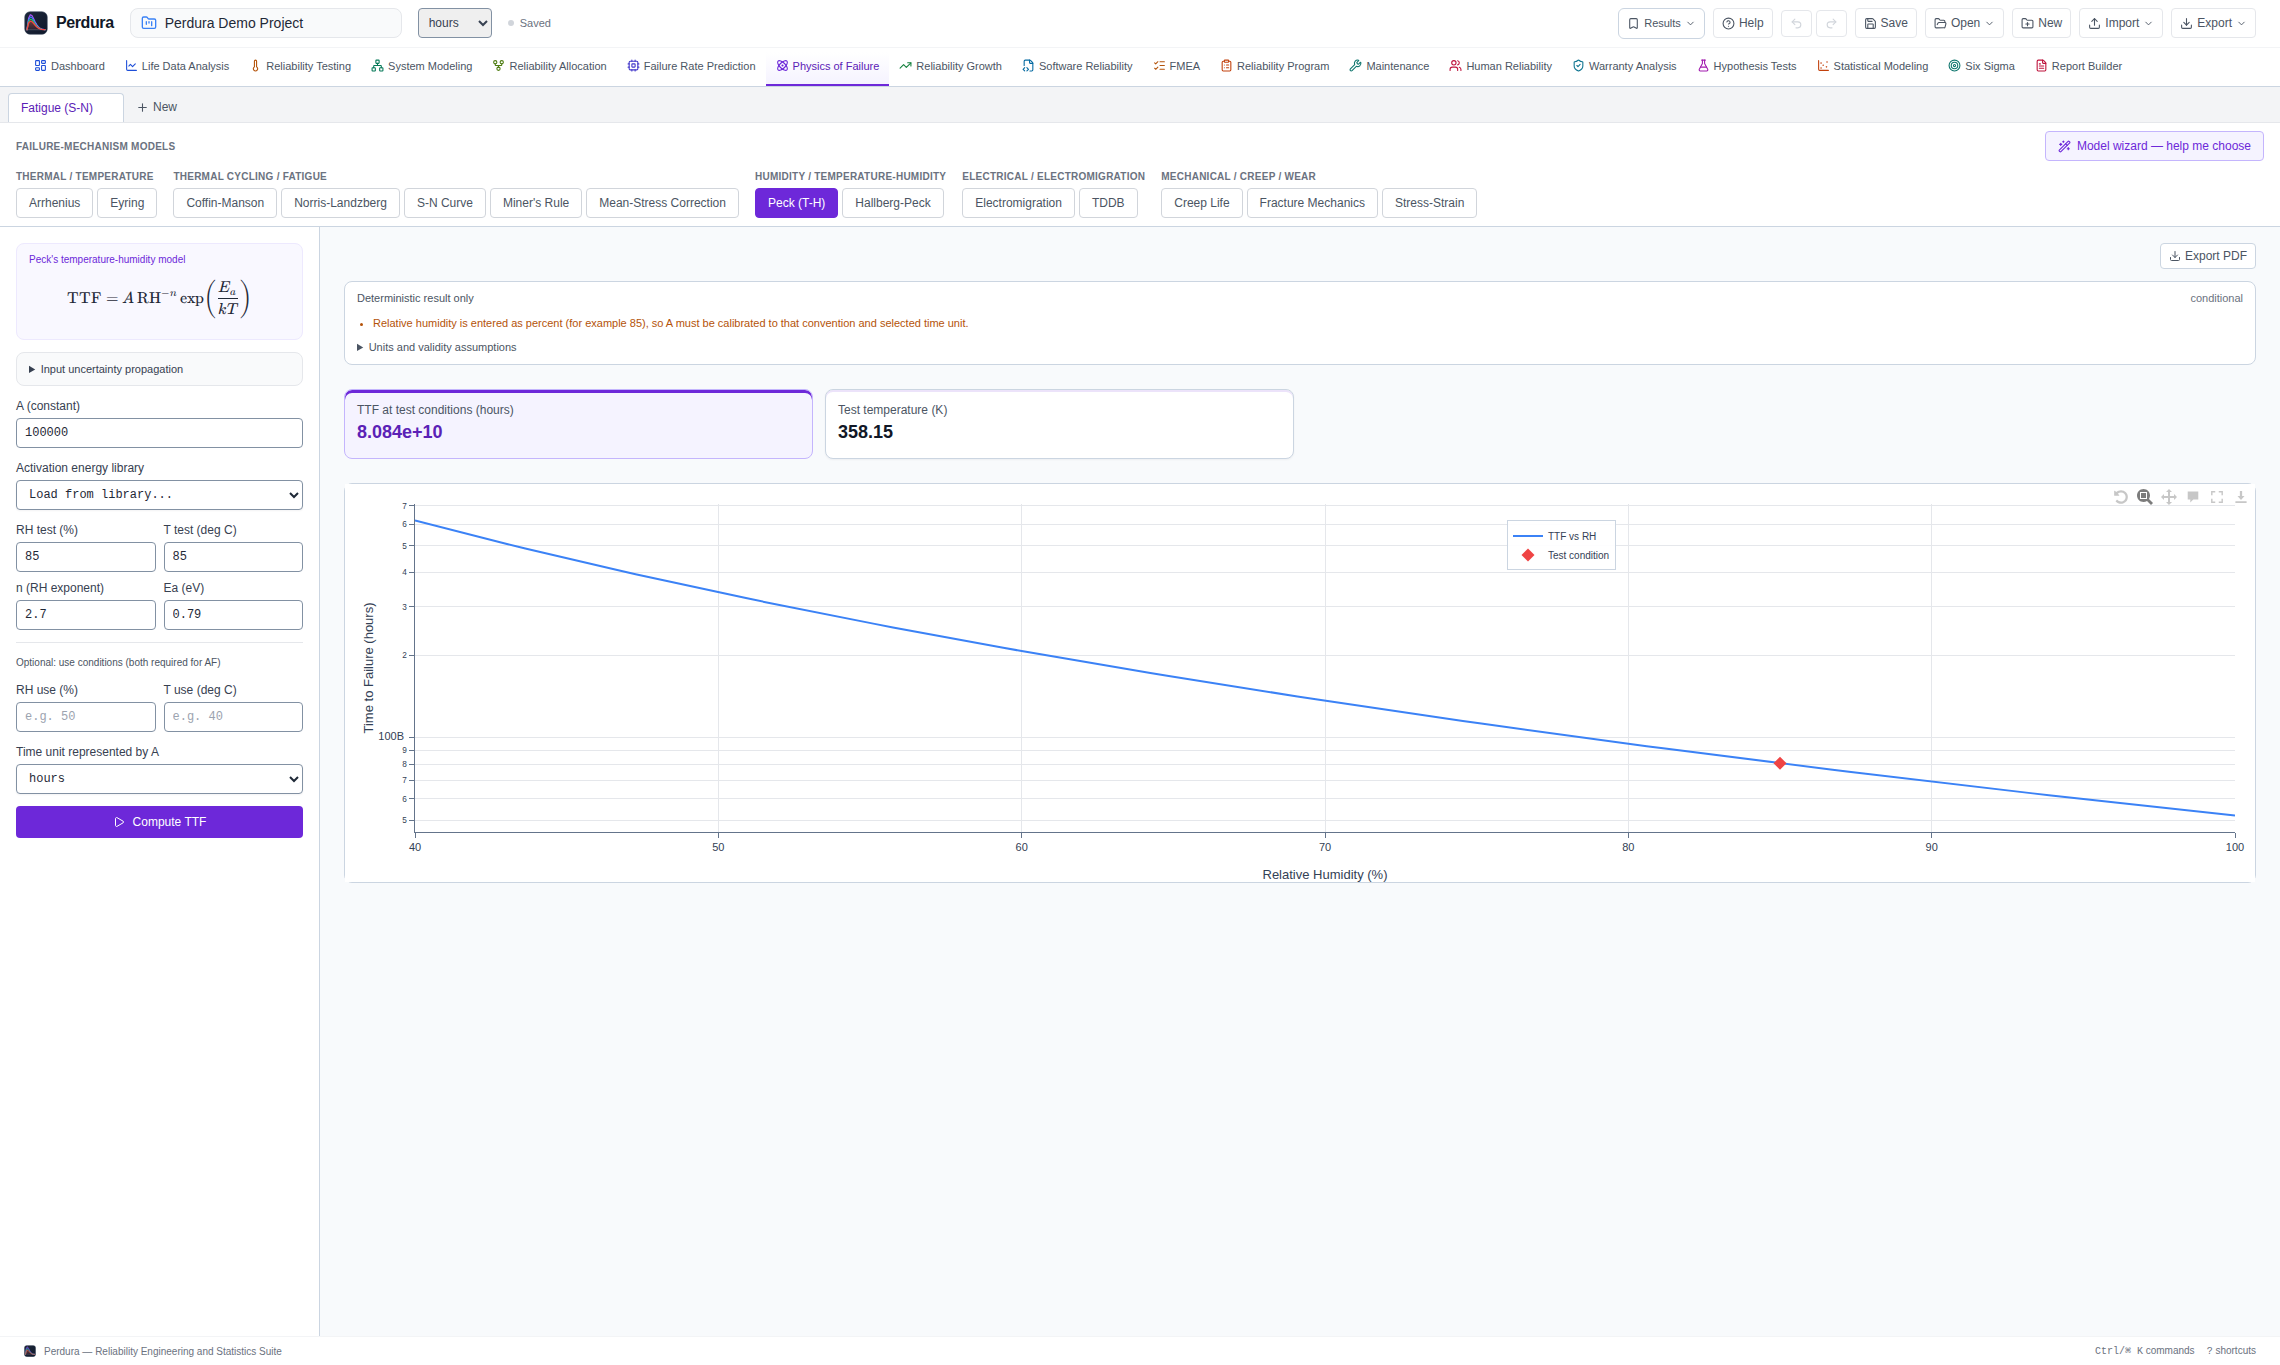
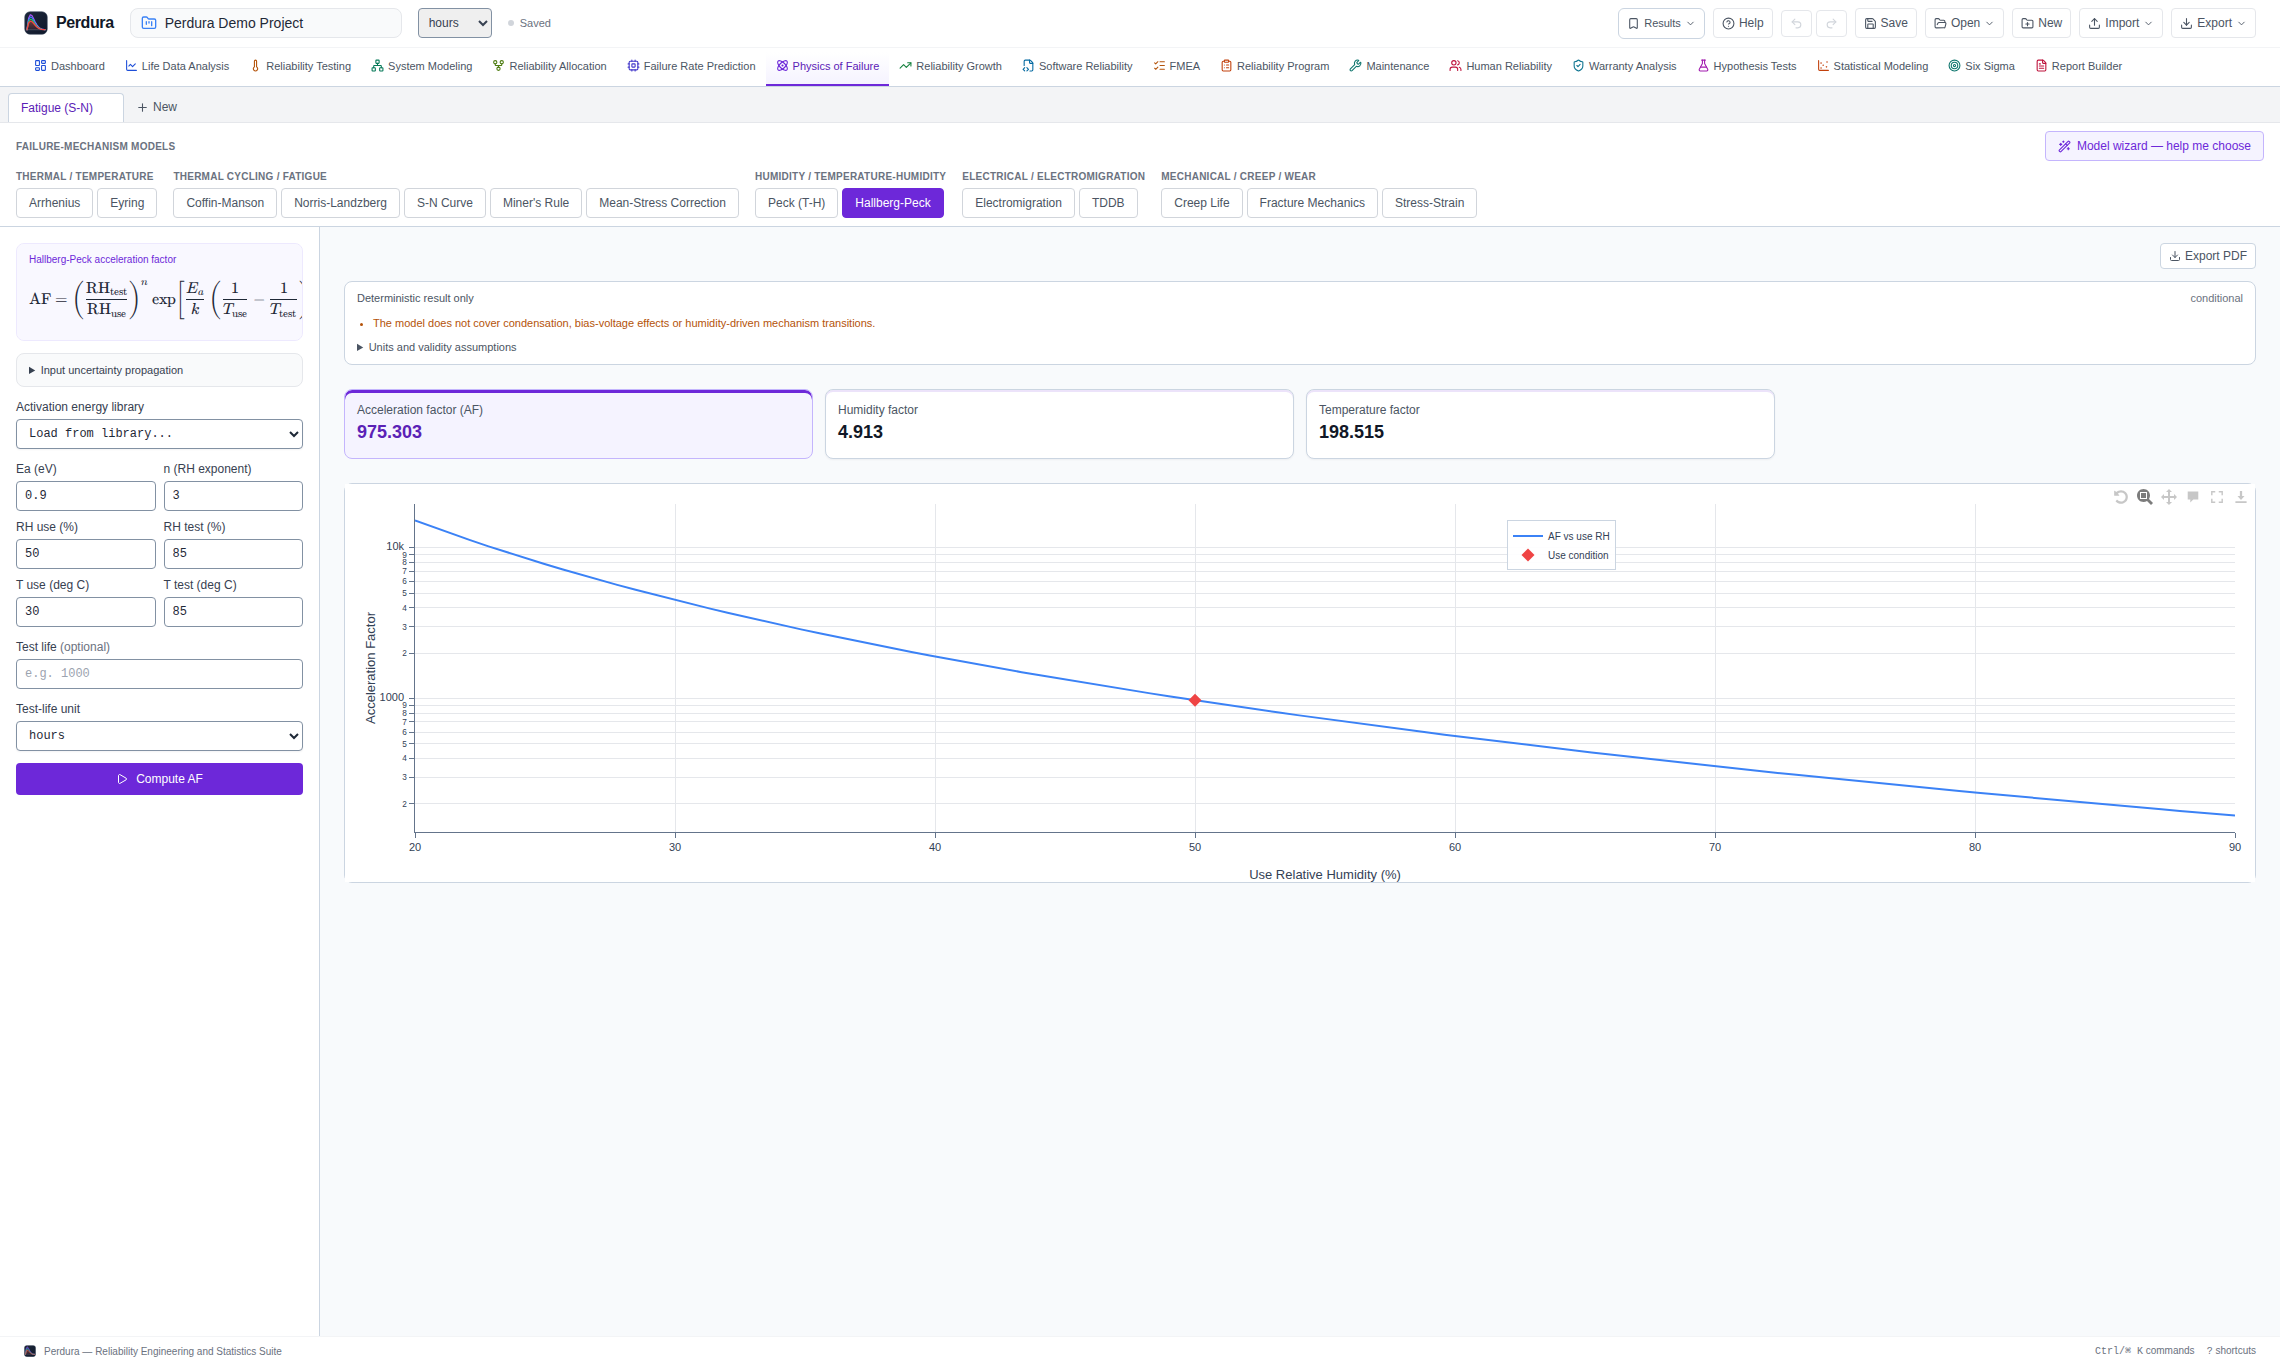
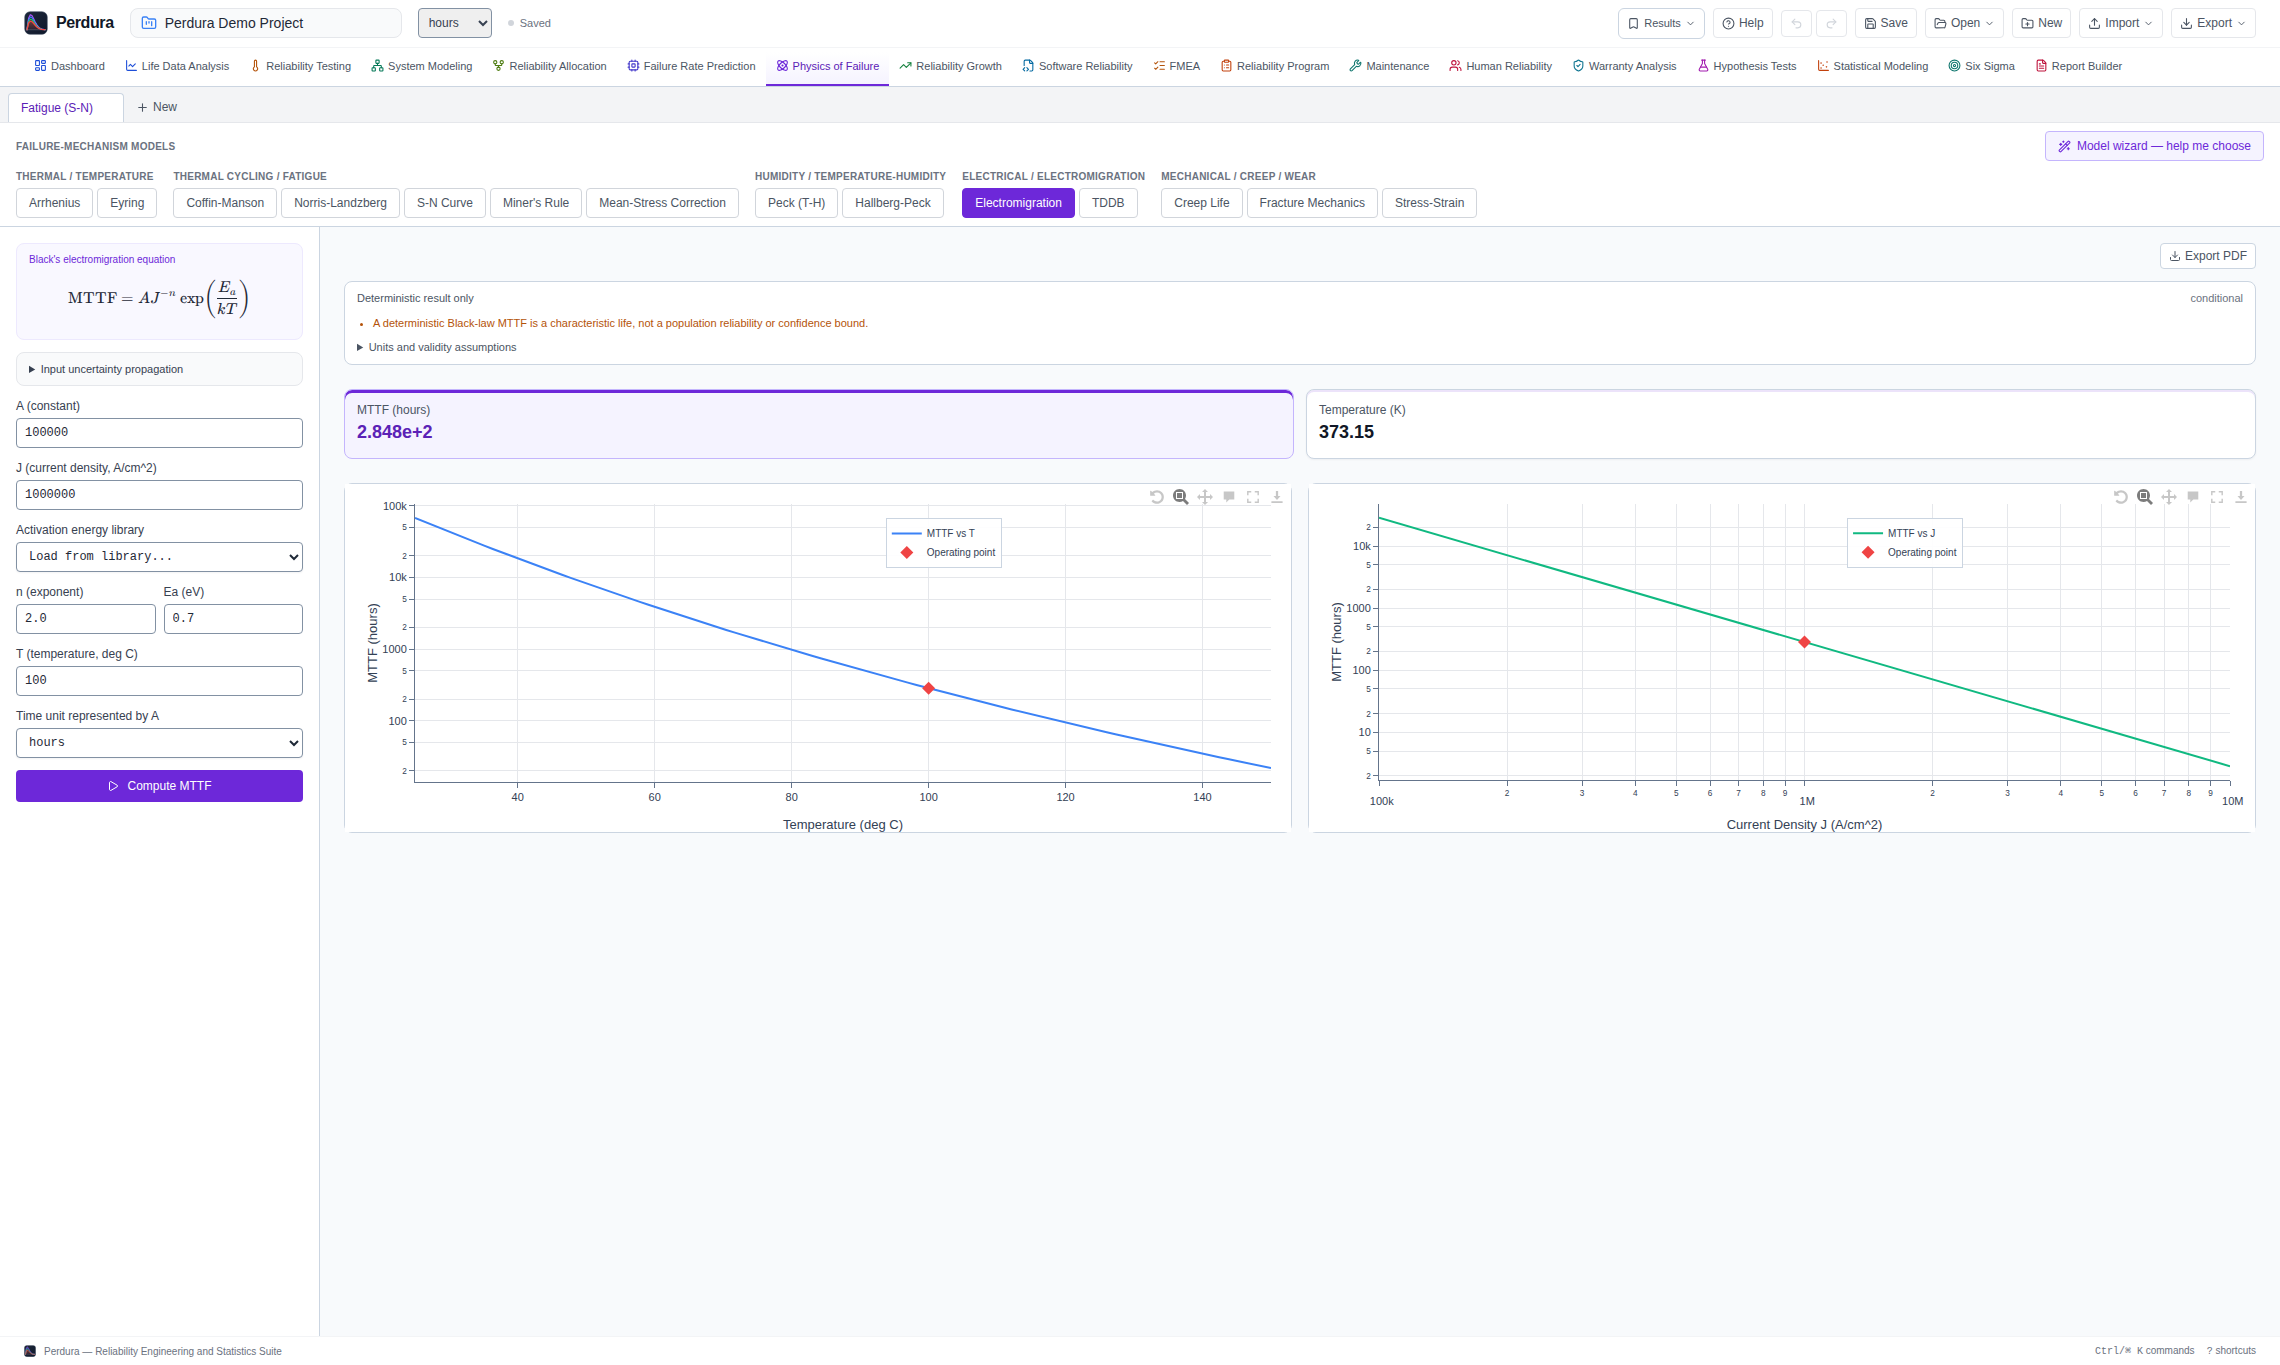
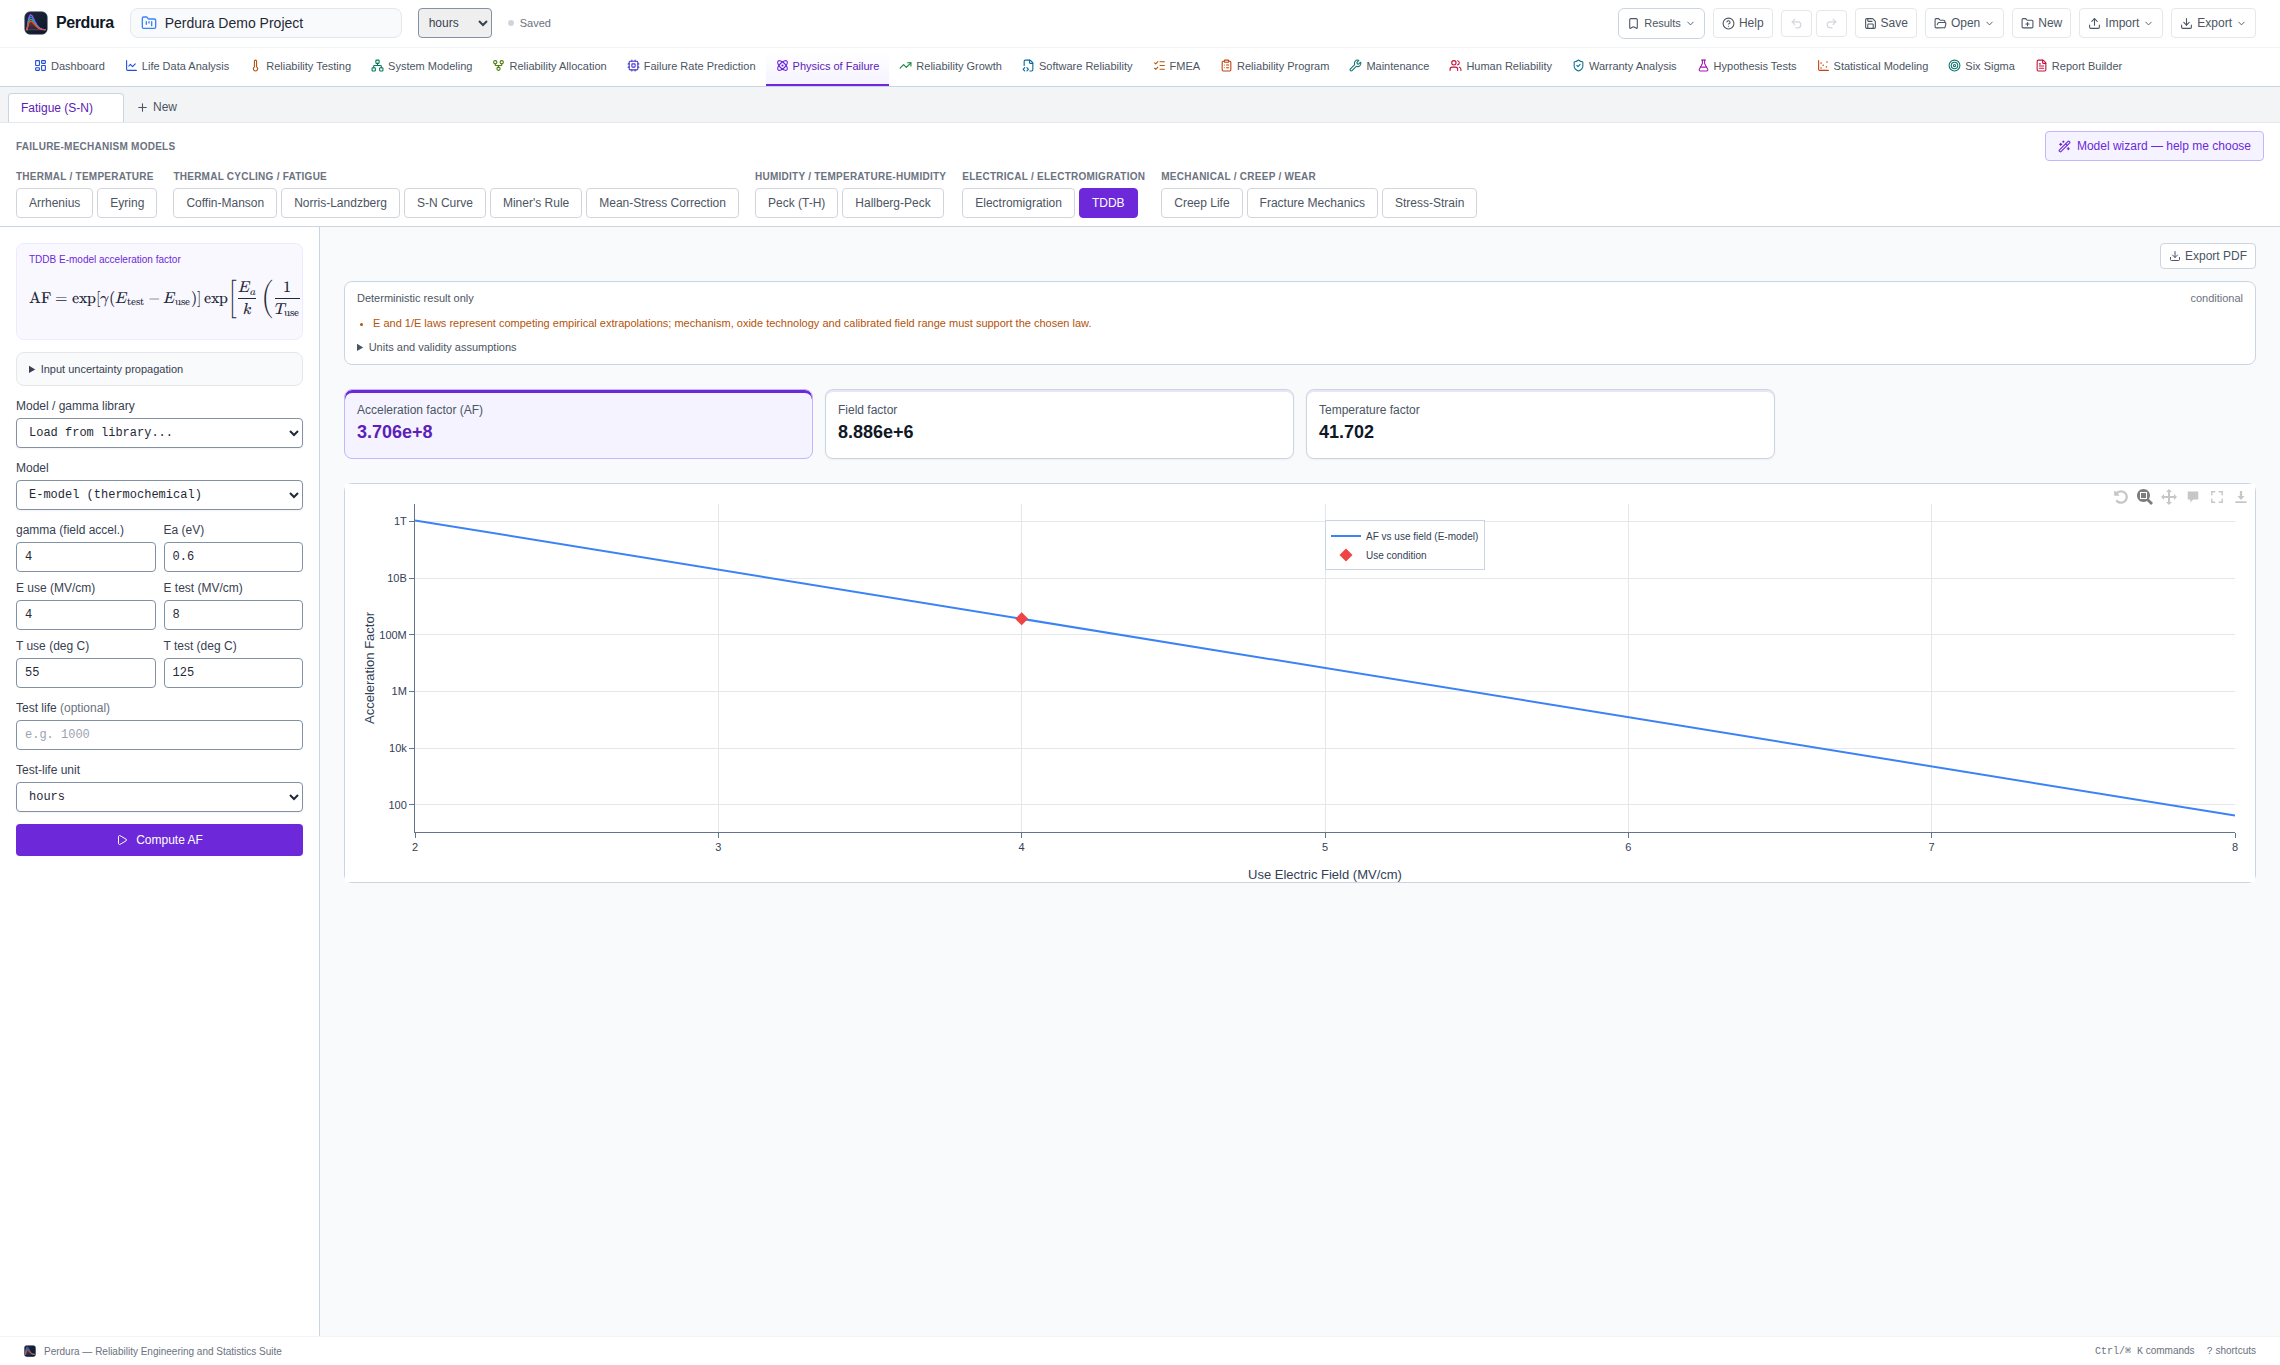
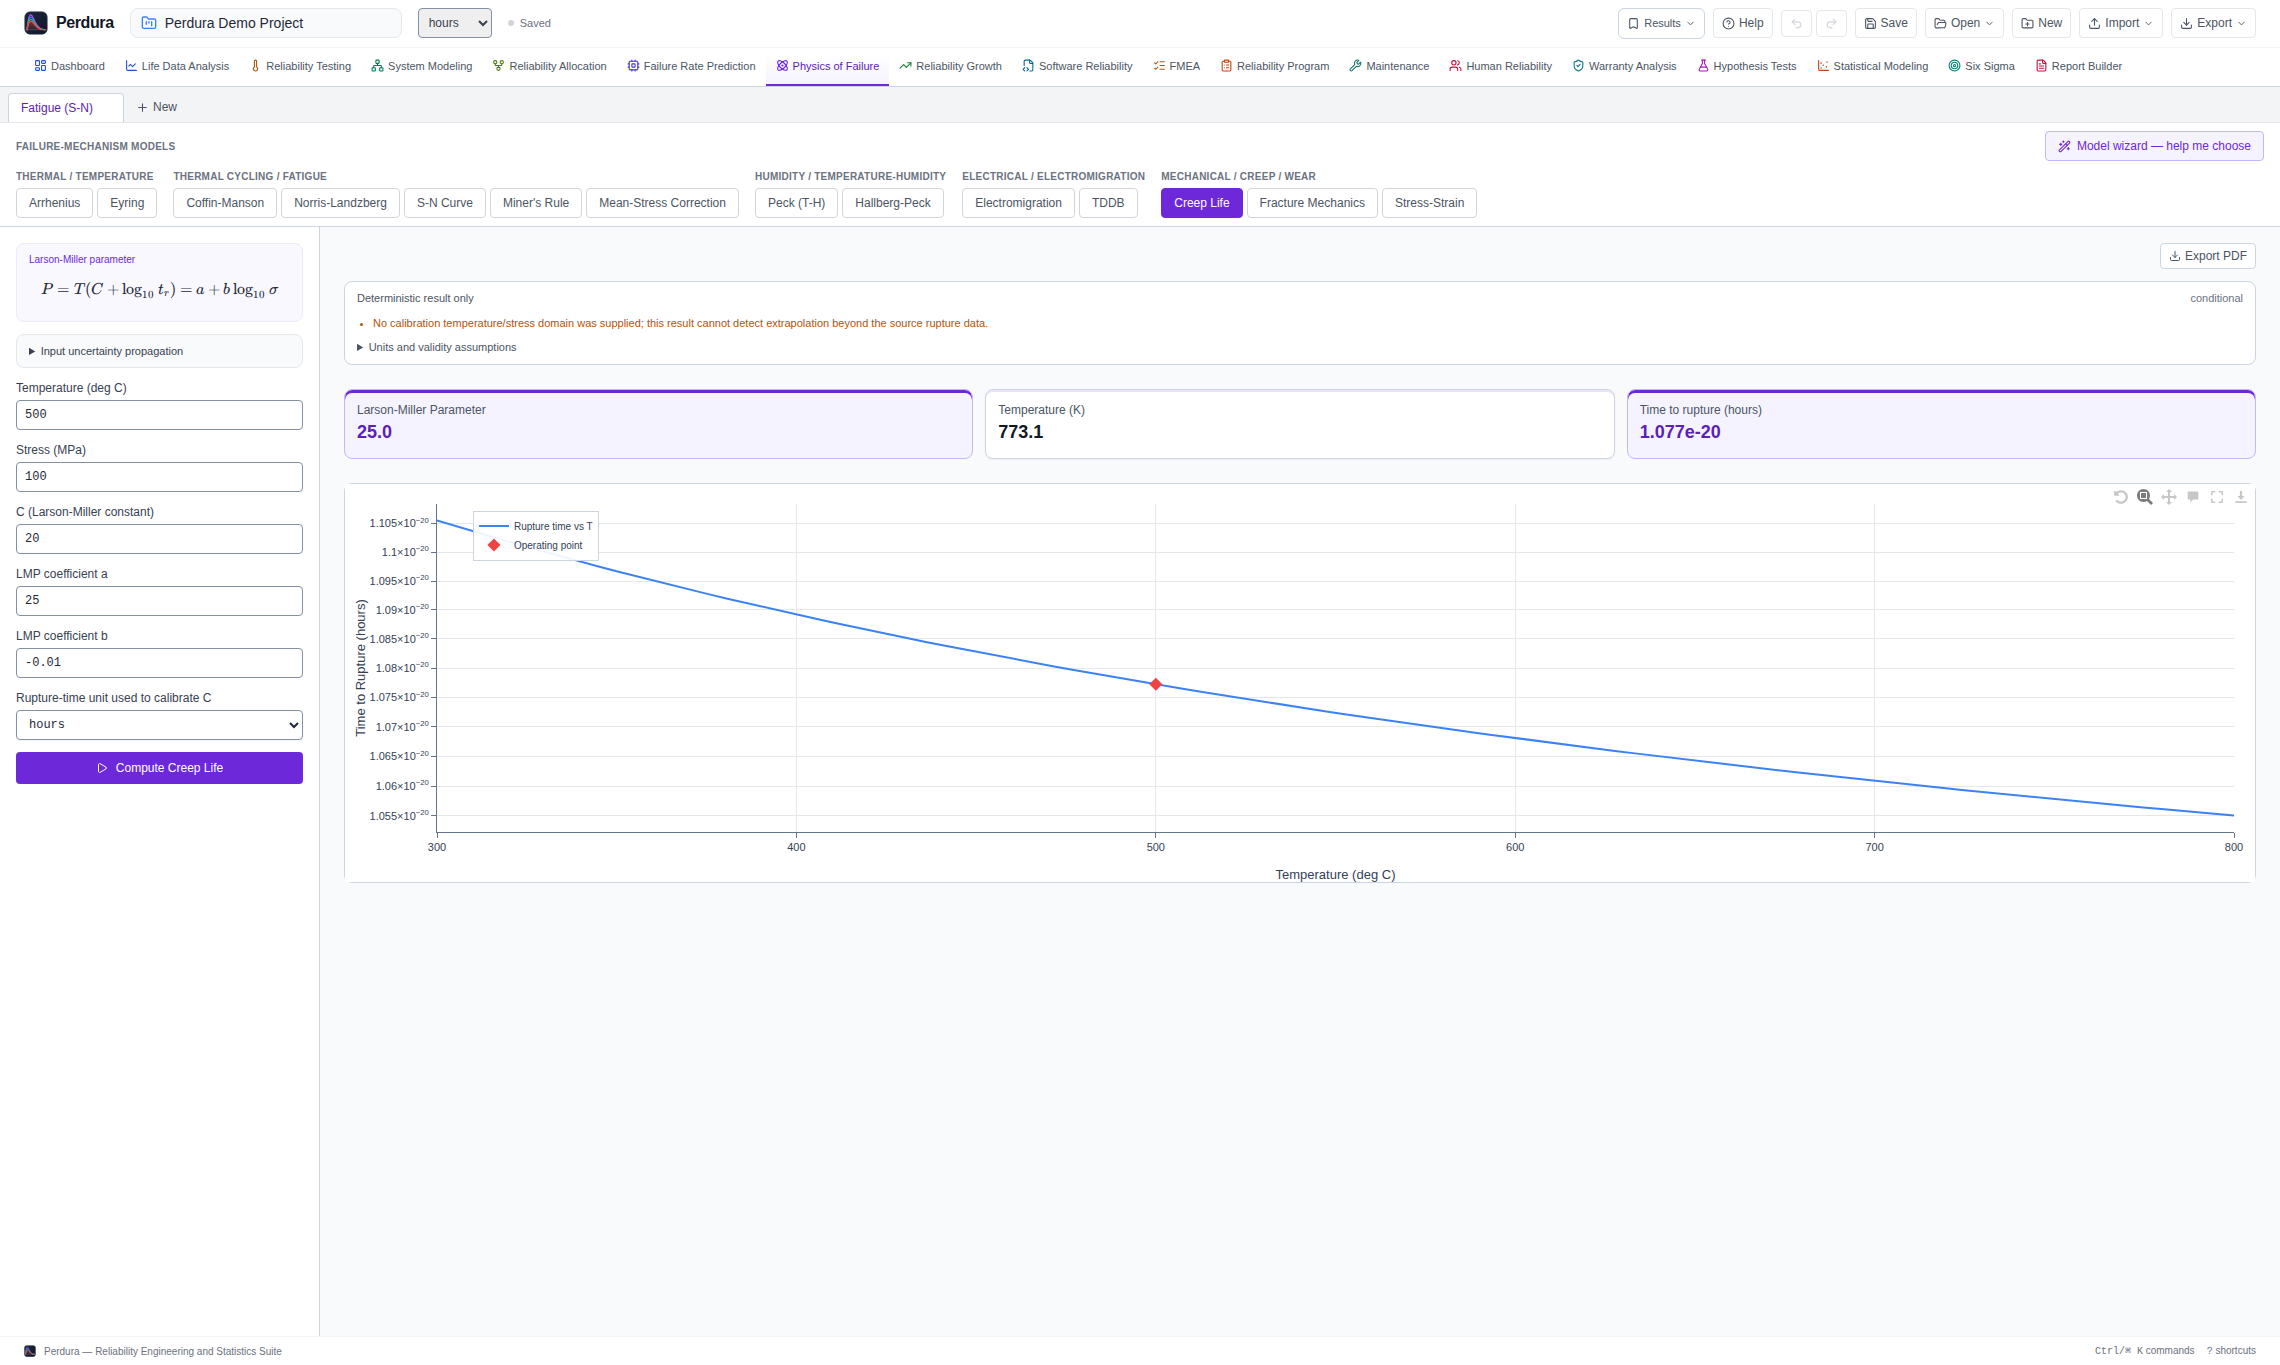
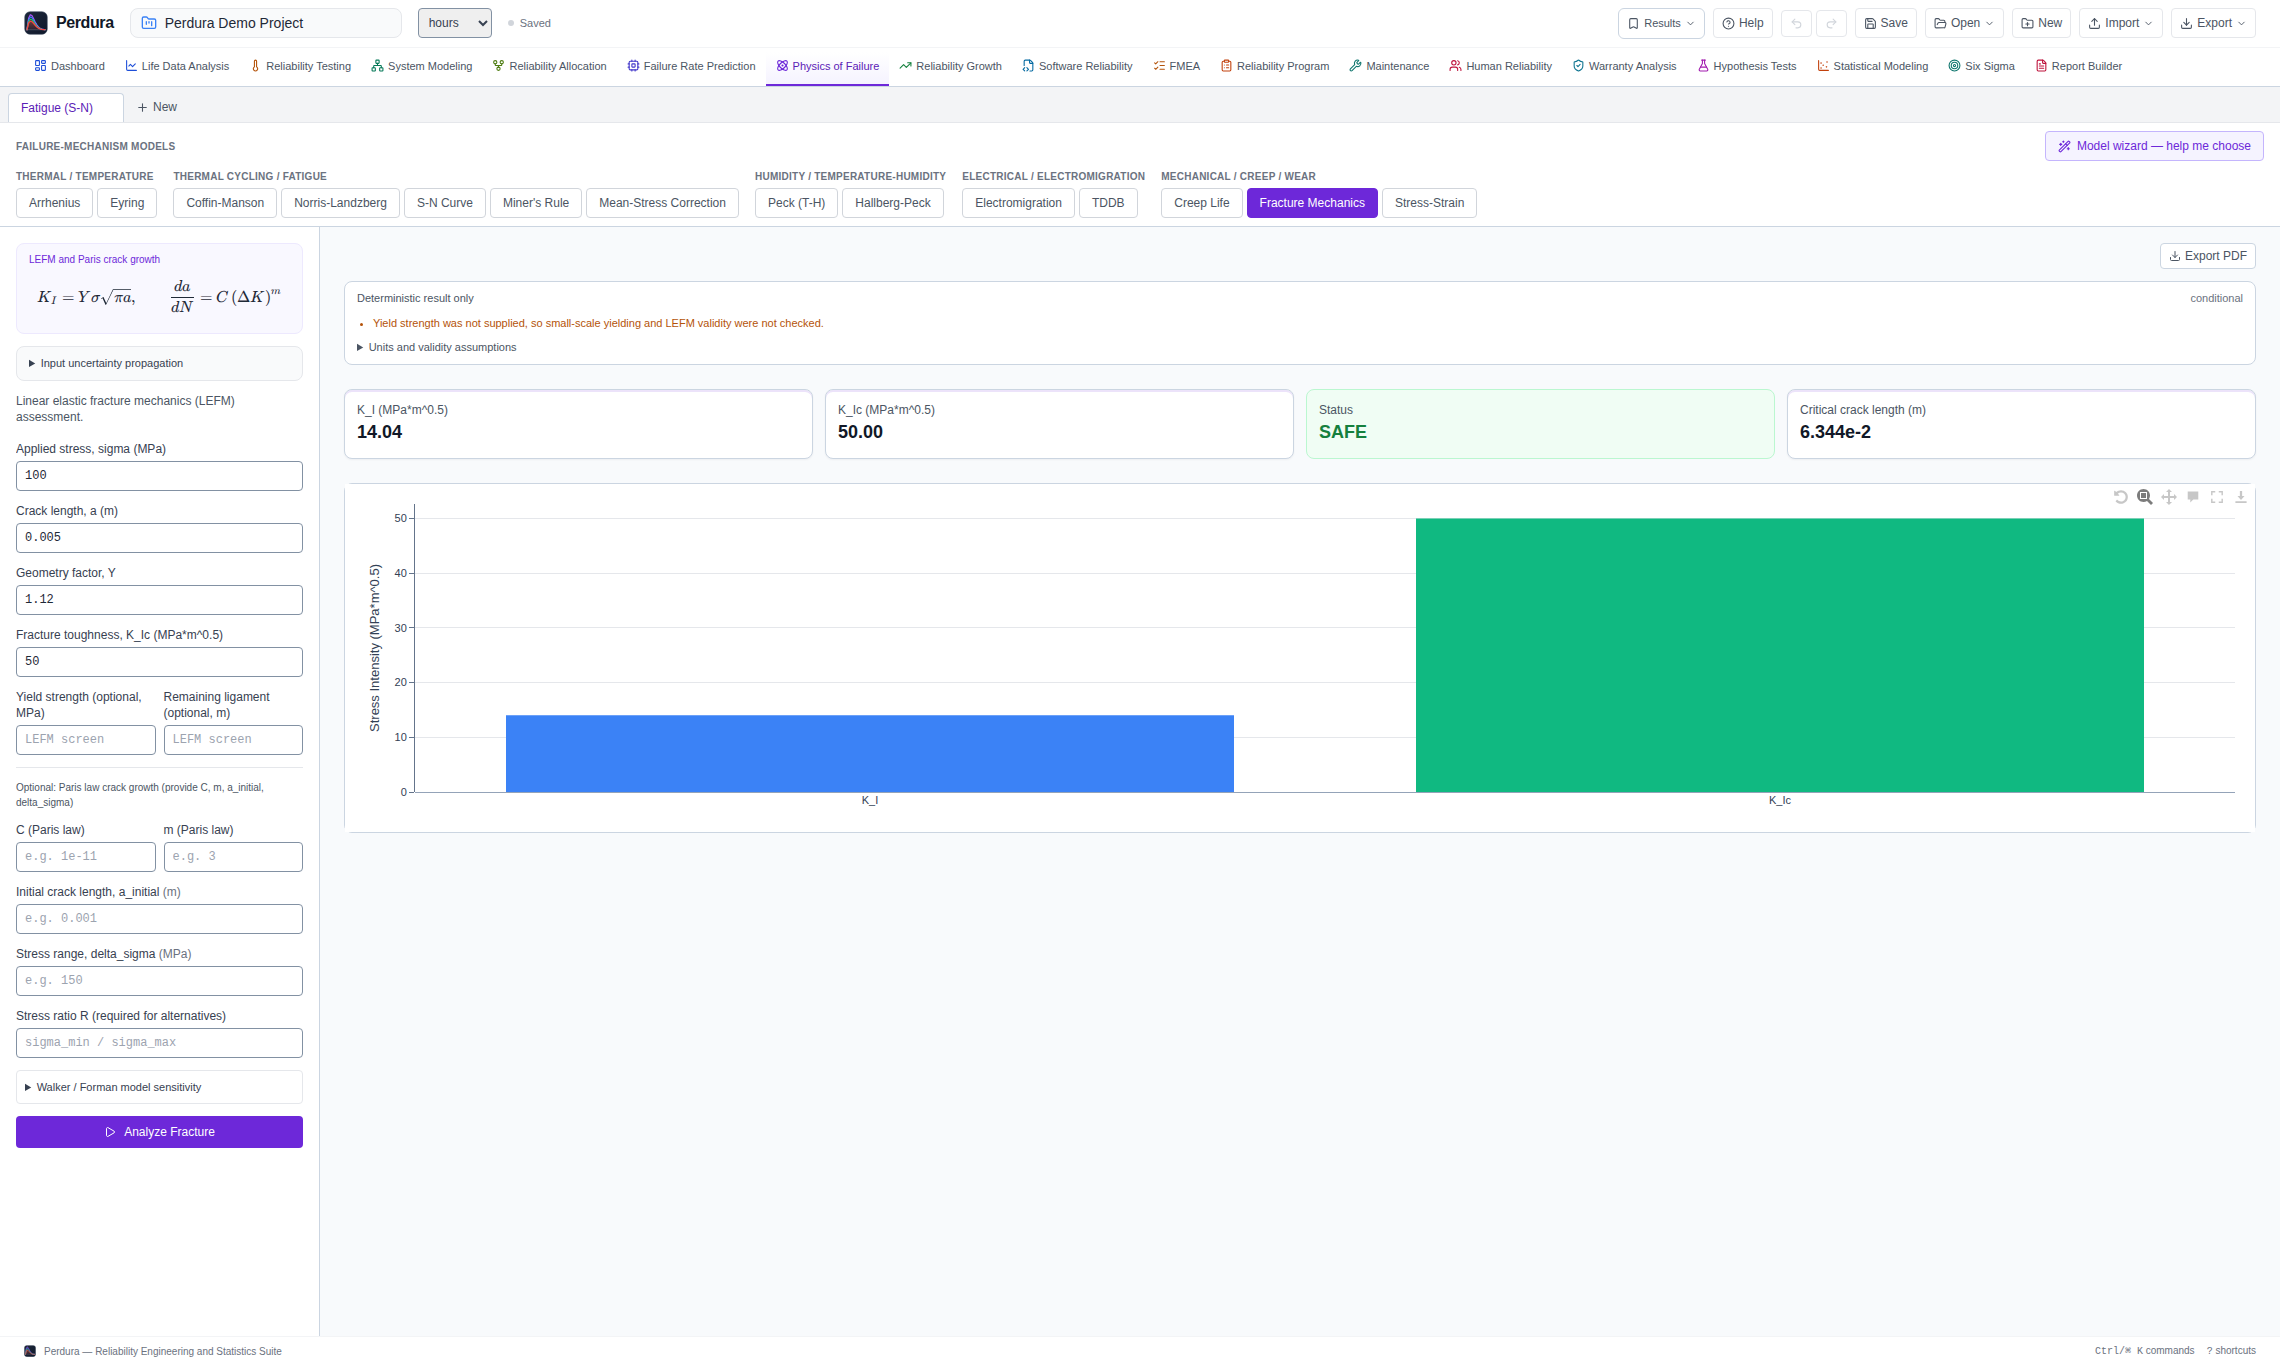
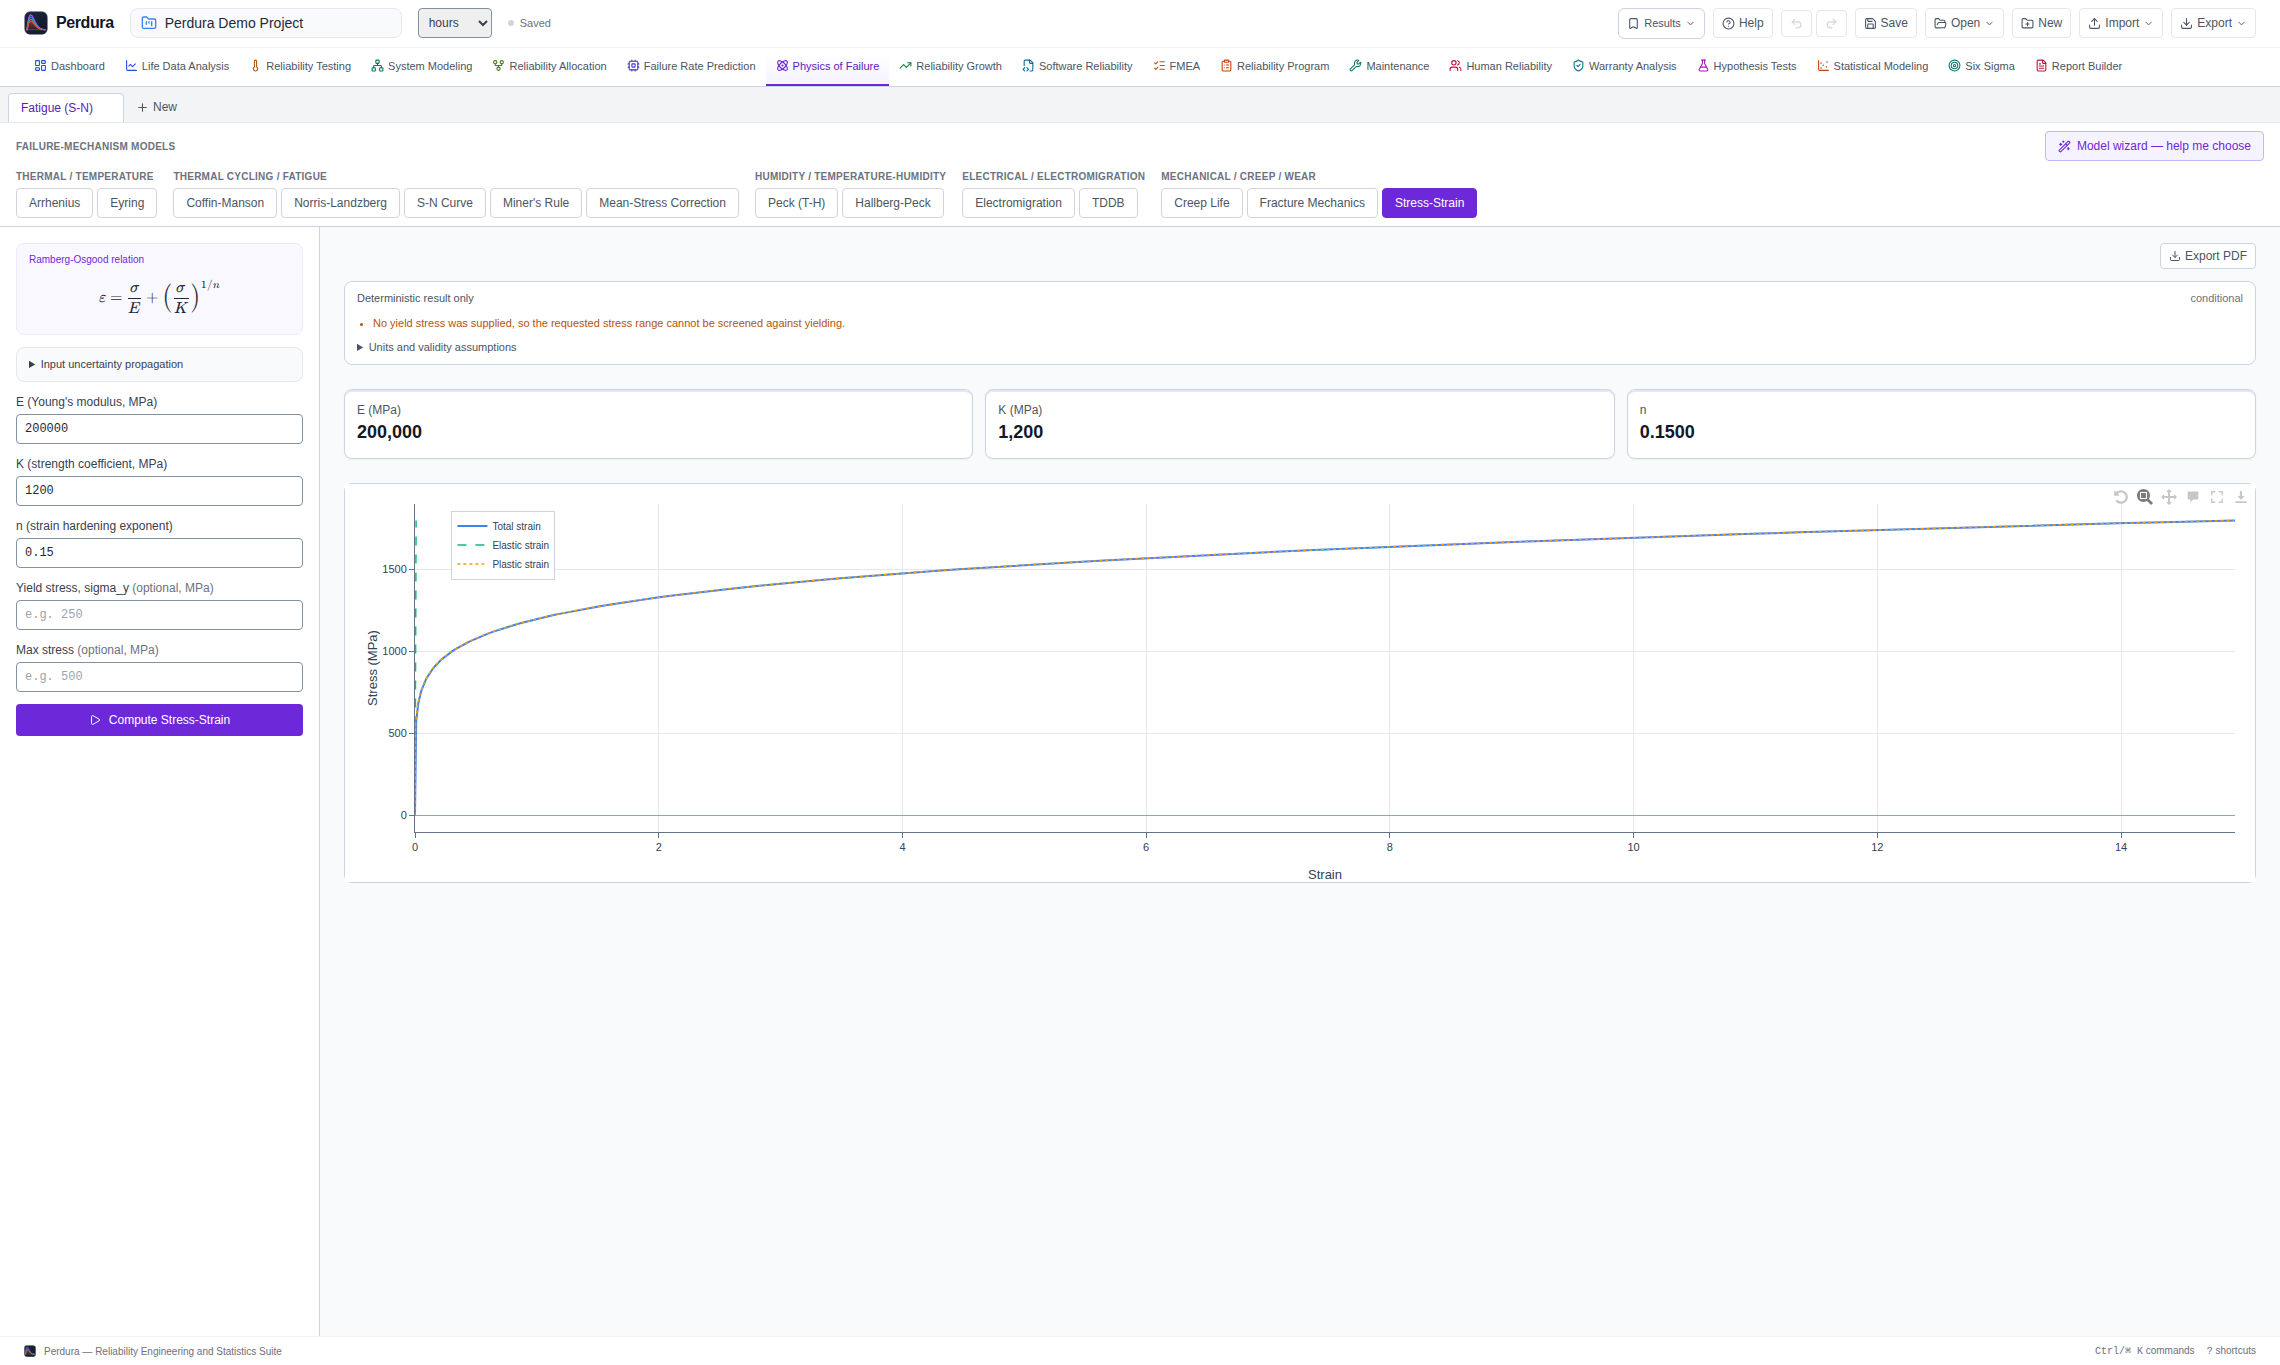
Use the arrows, arrow keys, or swipe to review each analysis. Open an image for full resolution.
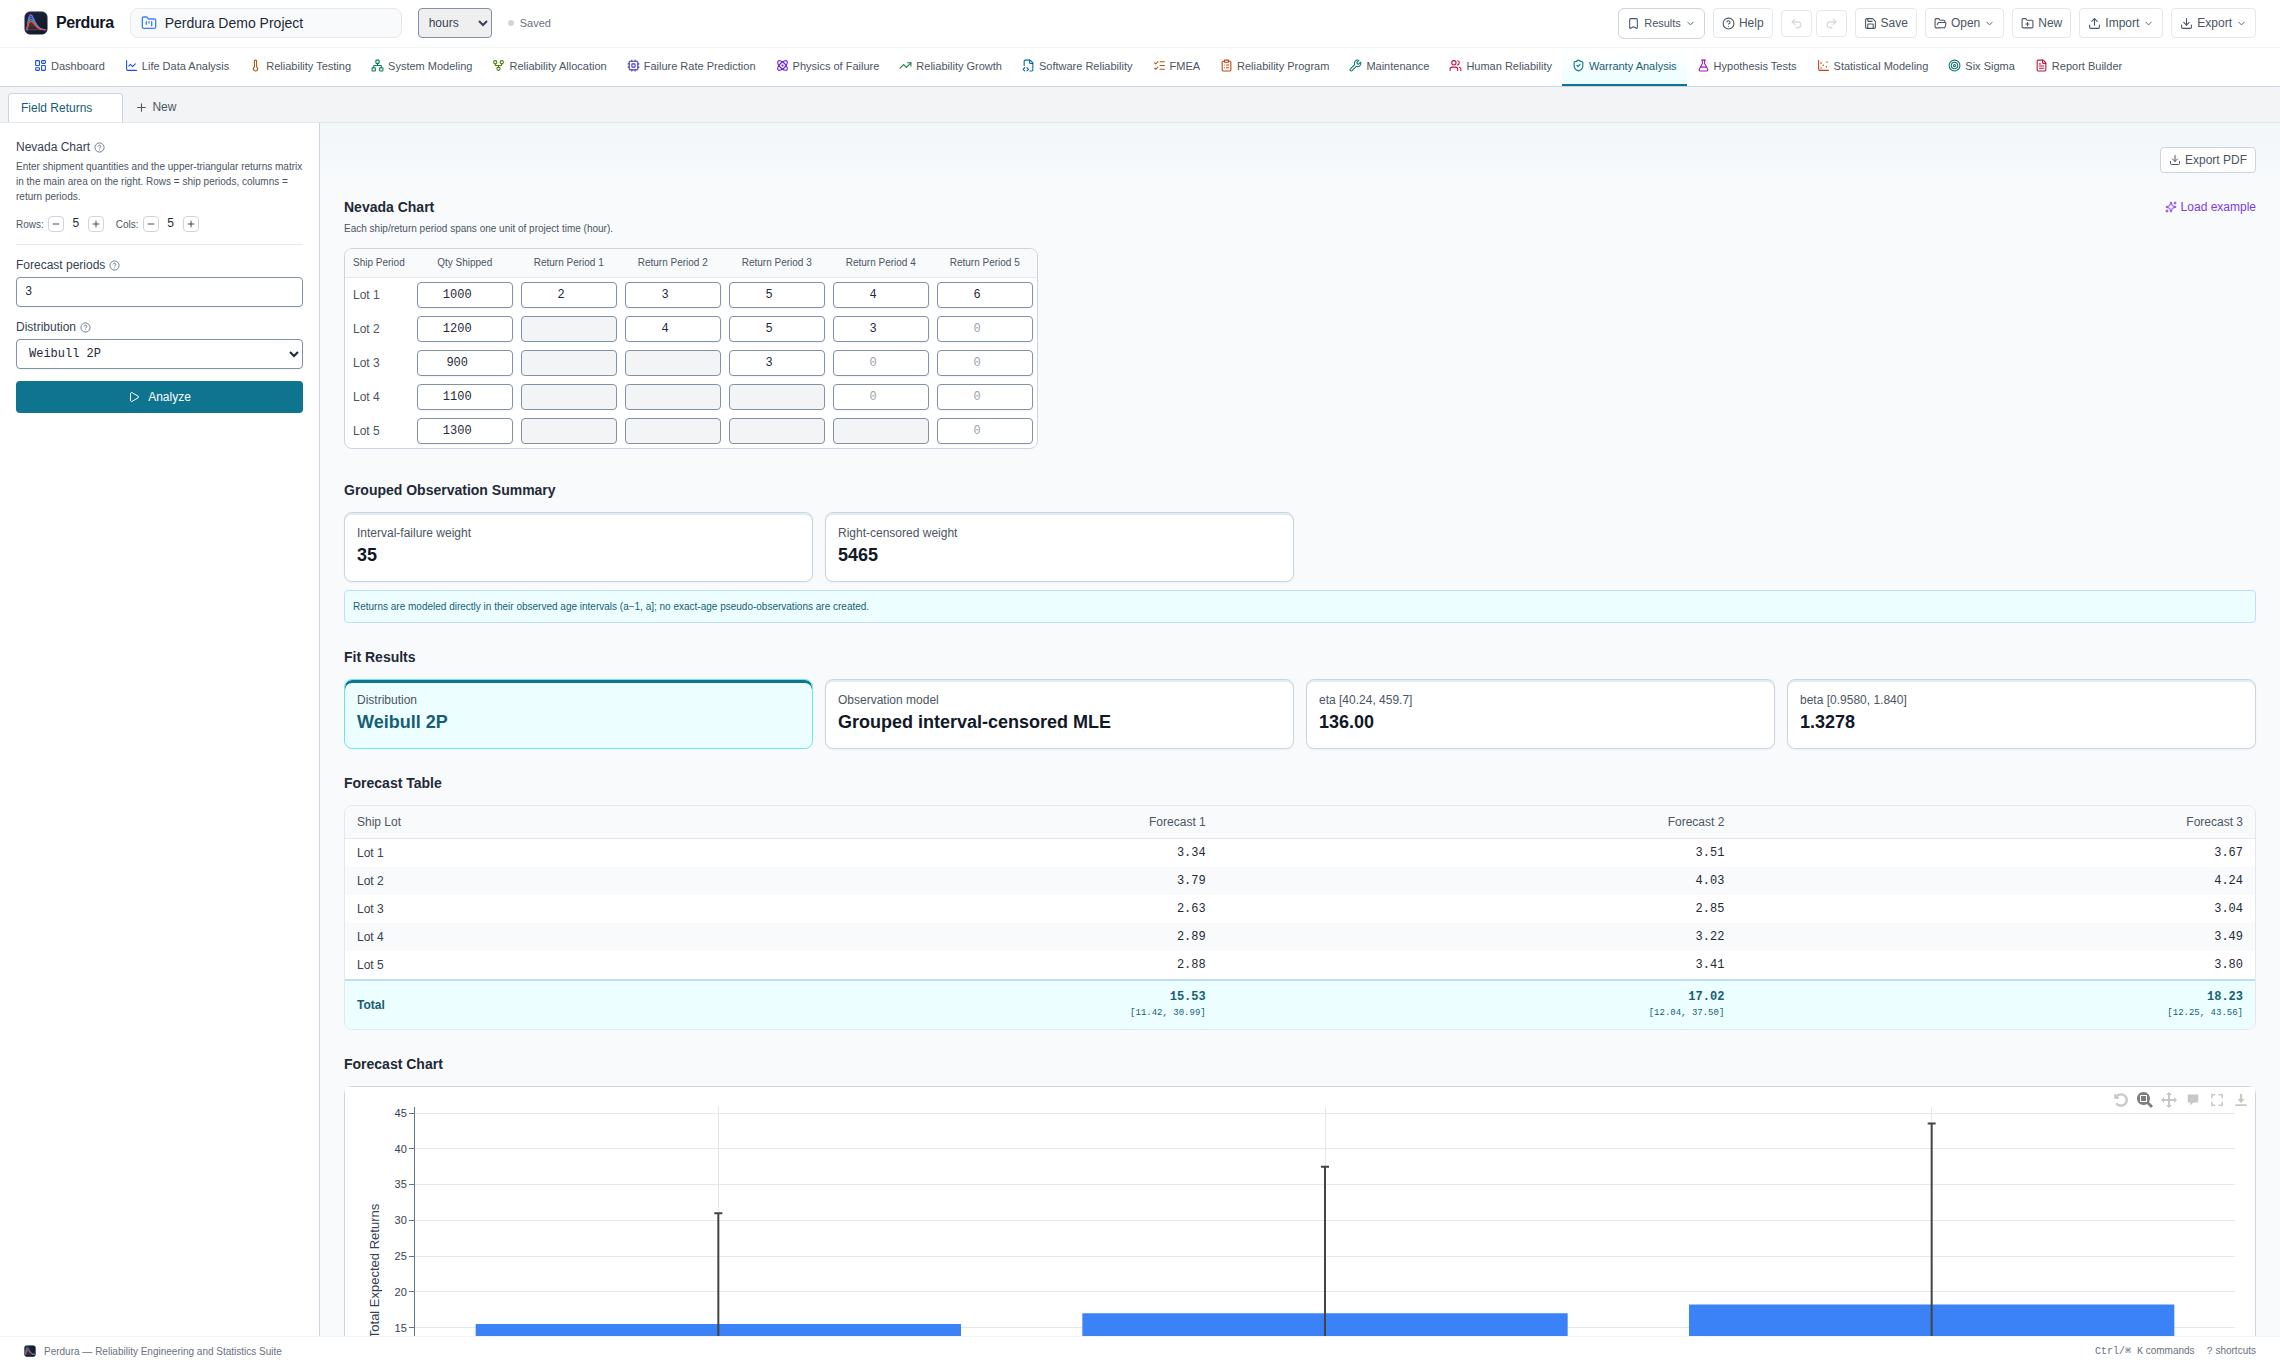
Warranty Data Analysis
Transform shipment and return records into censored life data, distribution estimates and return forecasts.
- Editable Nevada-chart matrix for shipment cohorts and warranty returns
- Conversion to complete failure times and right-censored exposure data
- Life-distribution estimation and conditional-CDF return forecasting
- Tabular and graphical forecasts for expected field returns
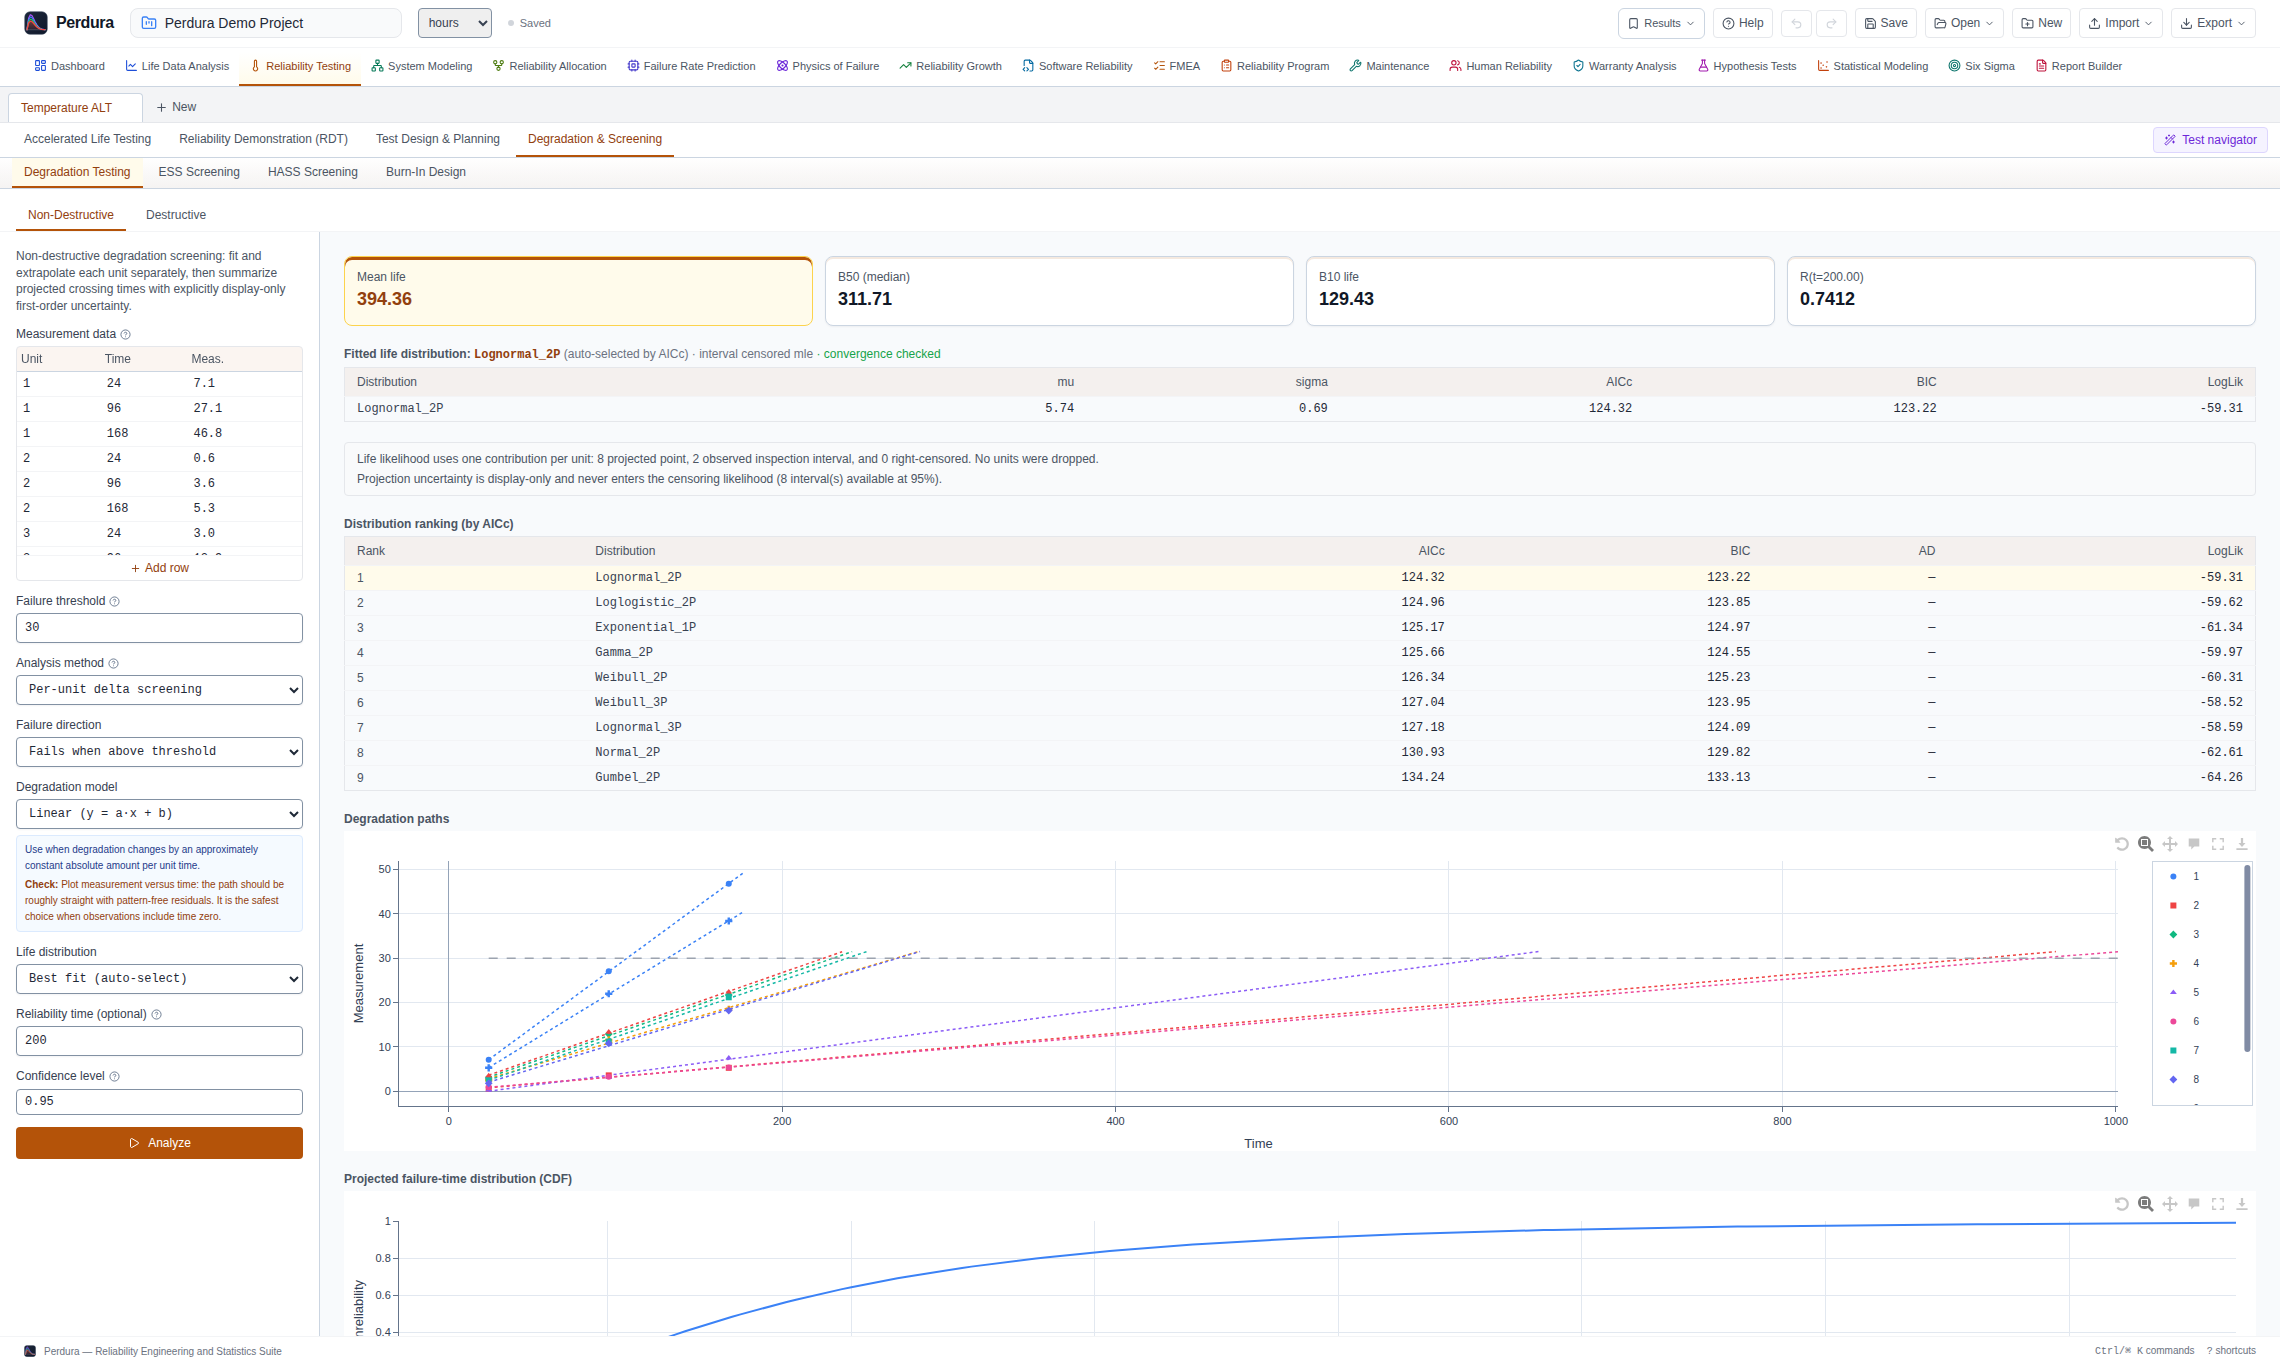
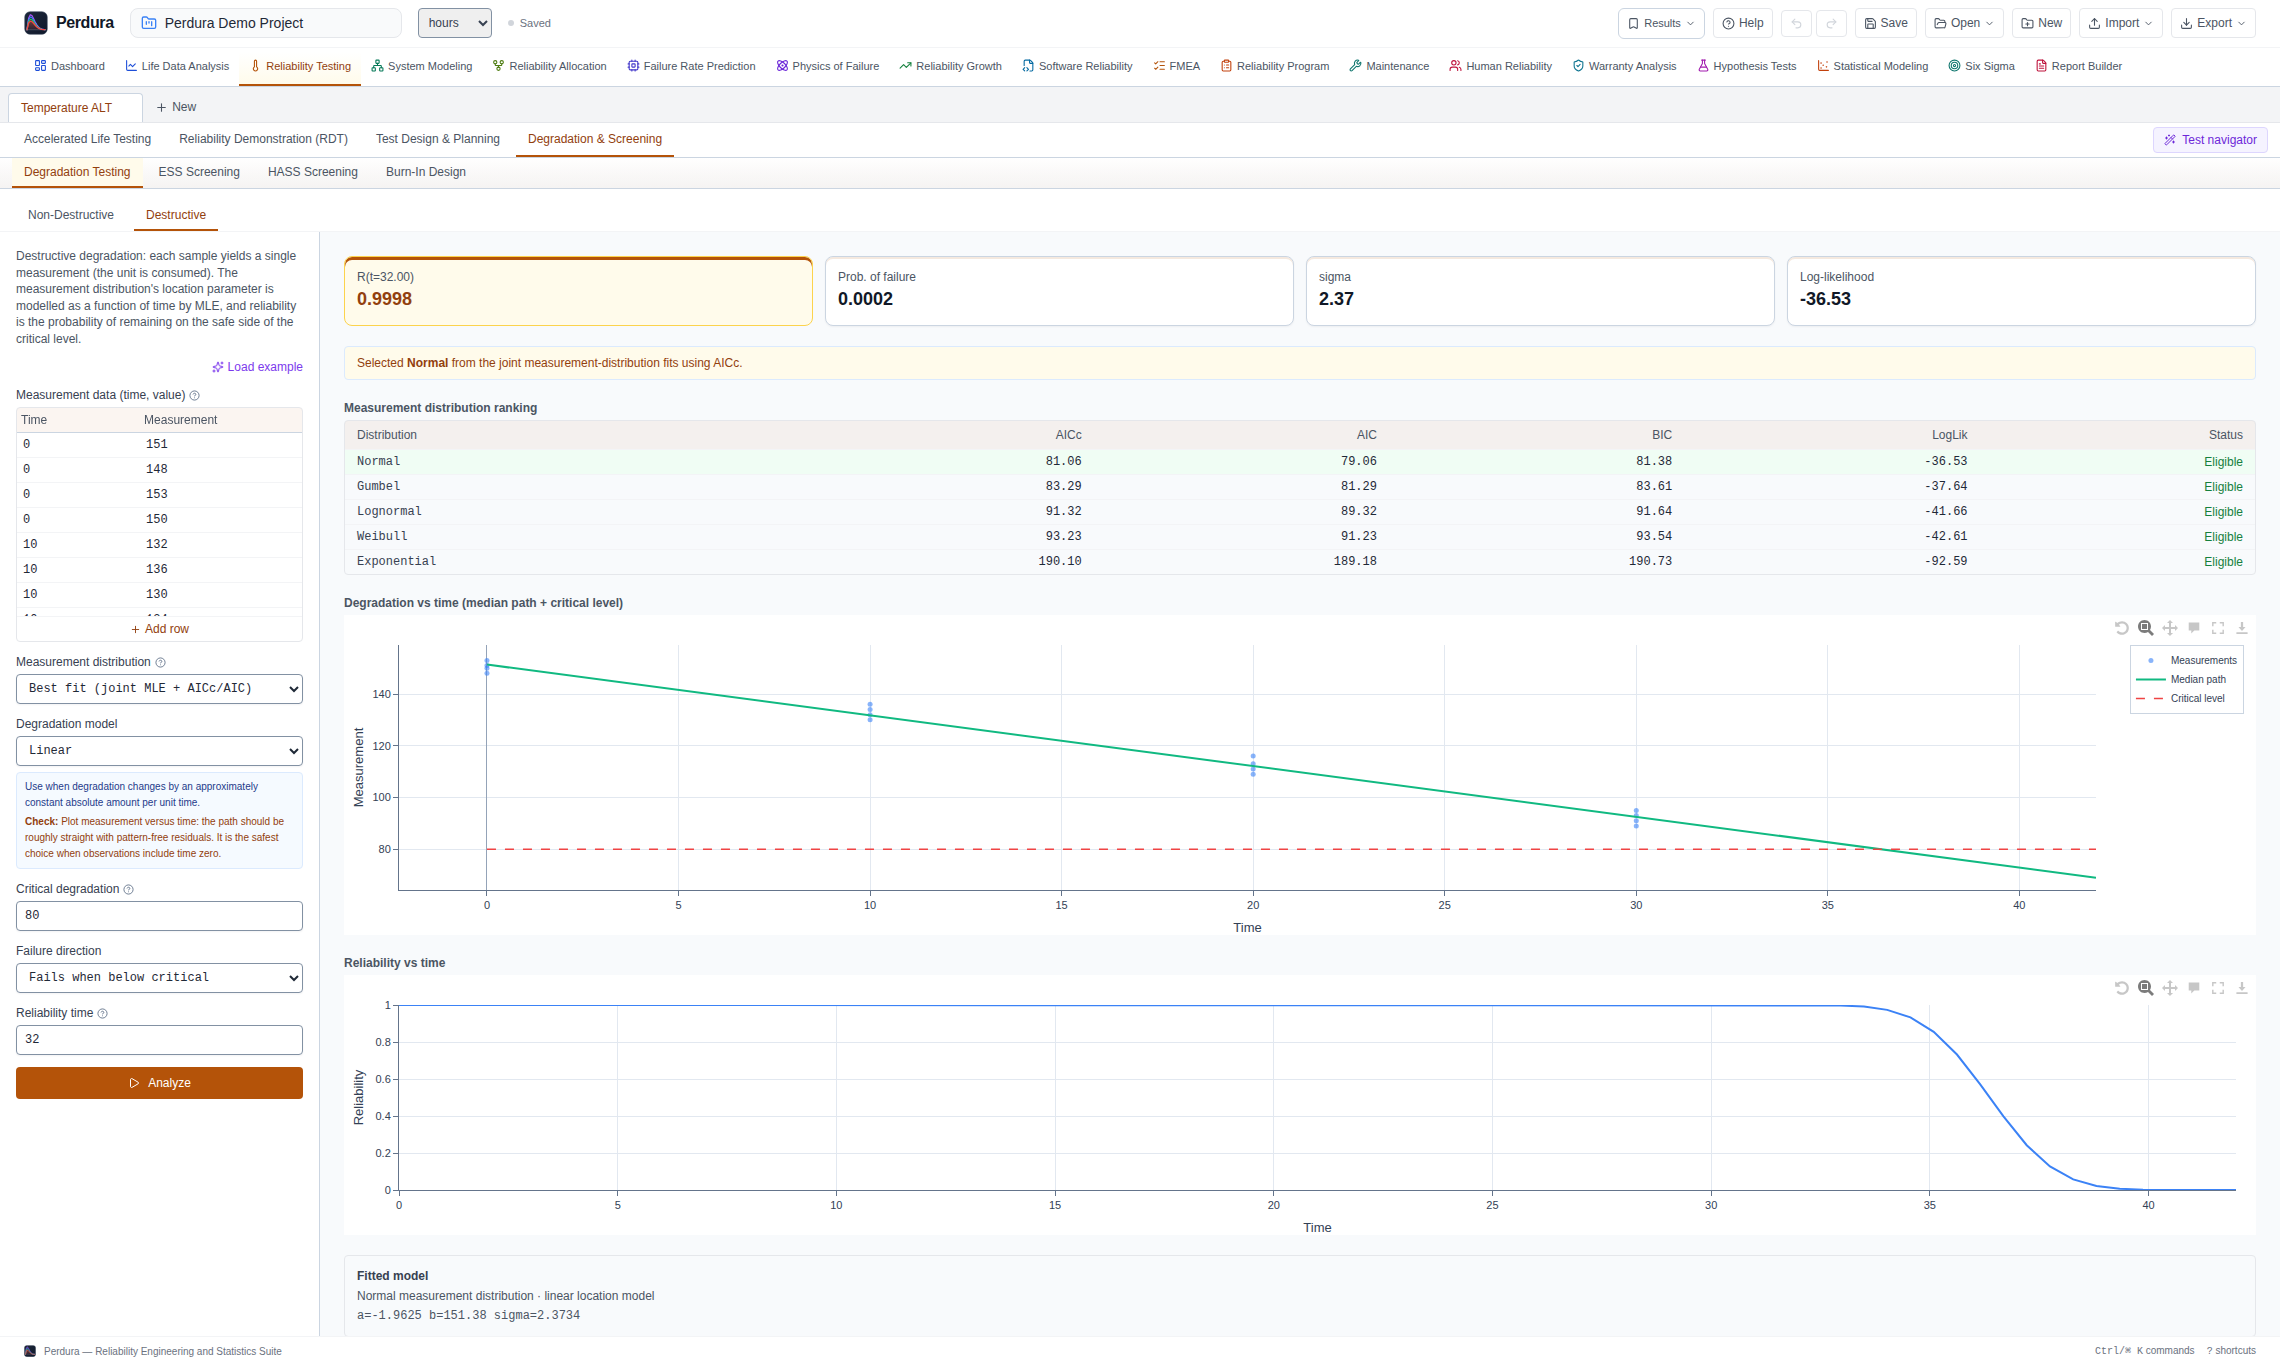
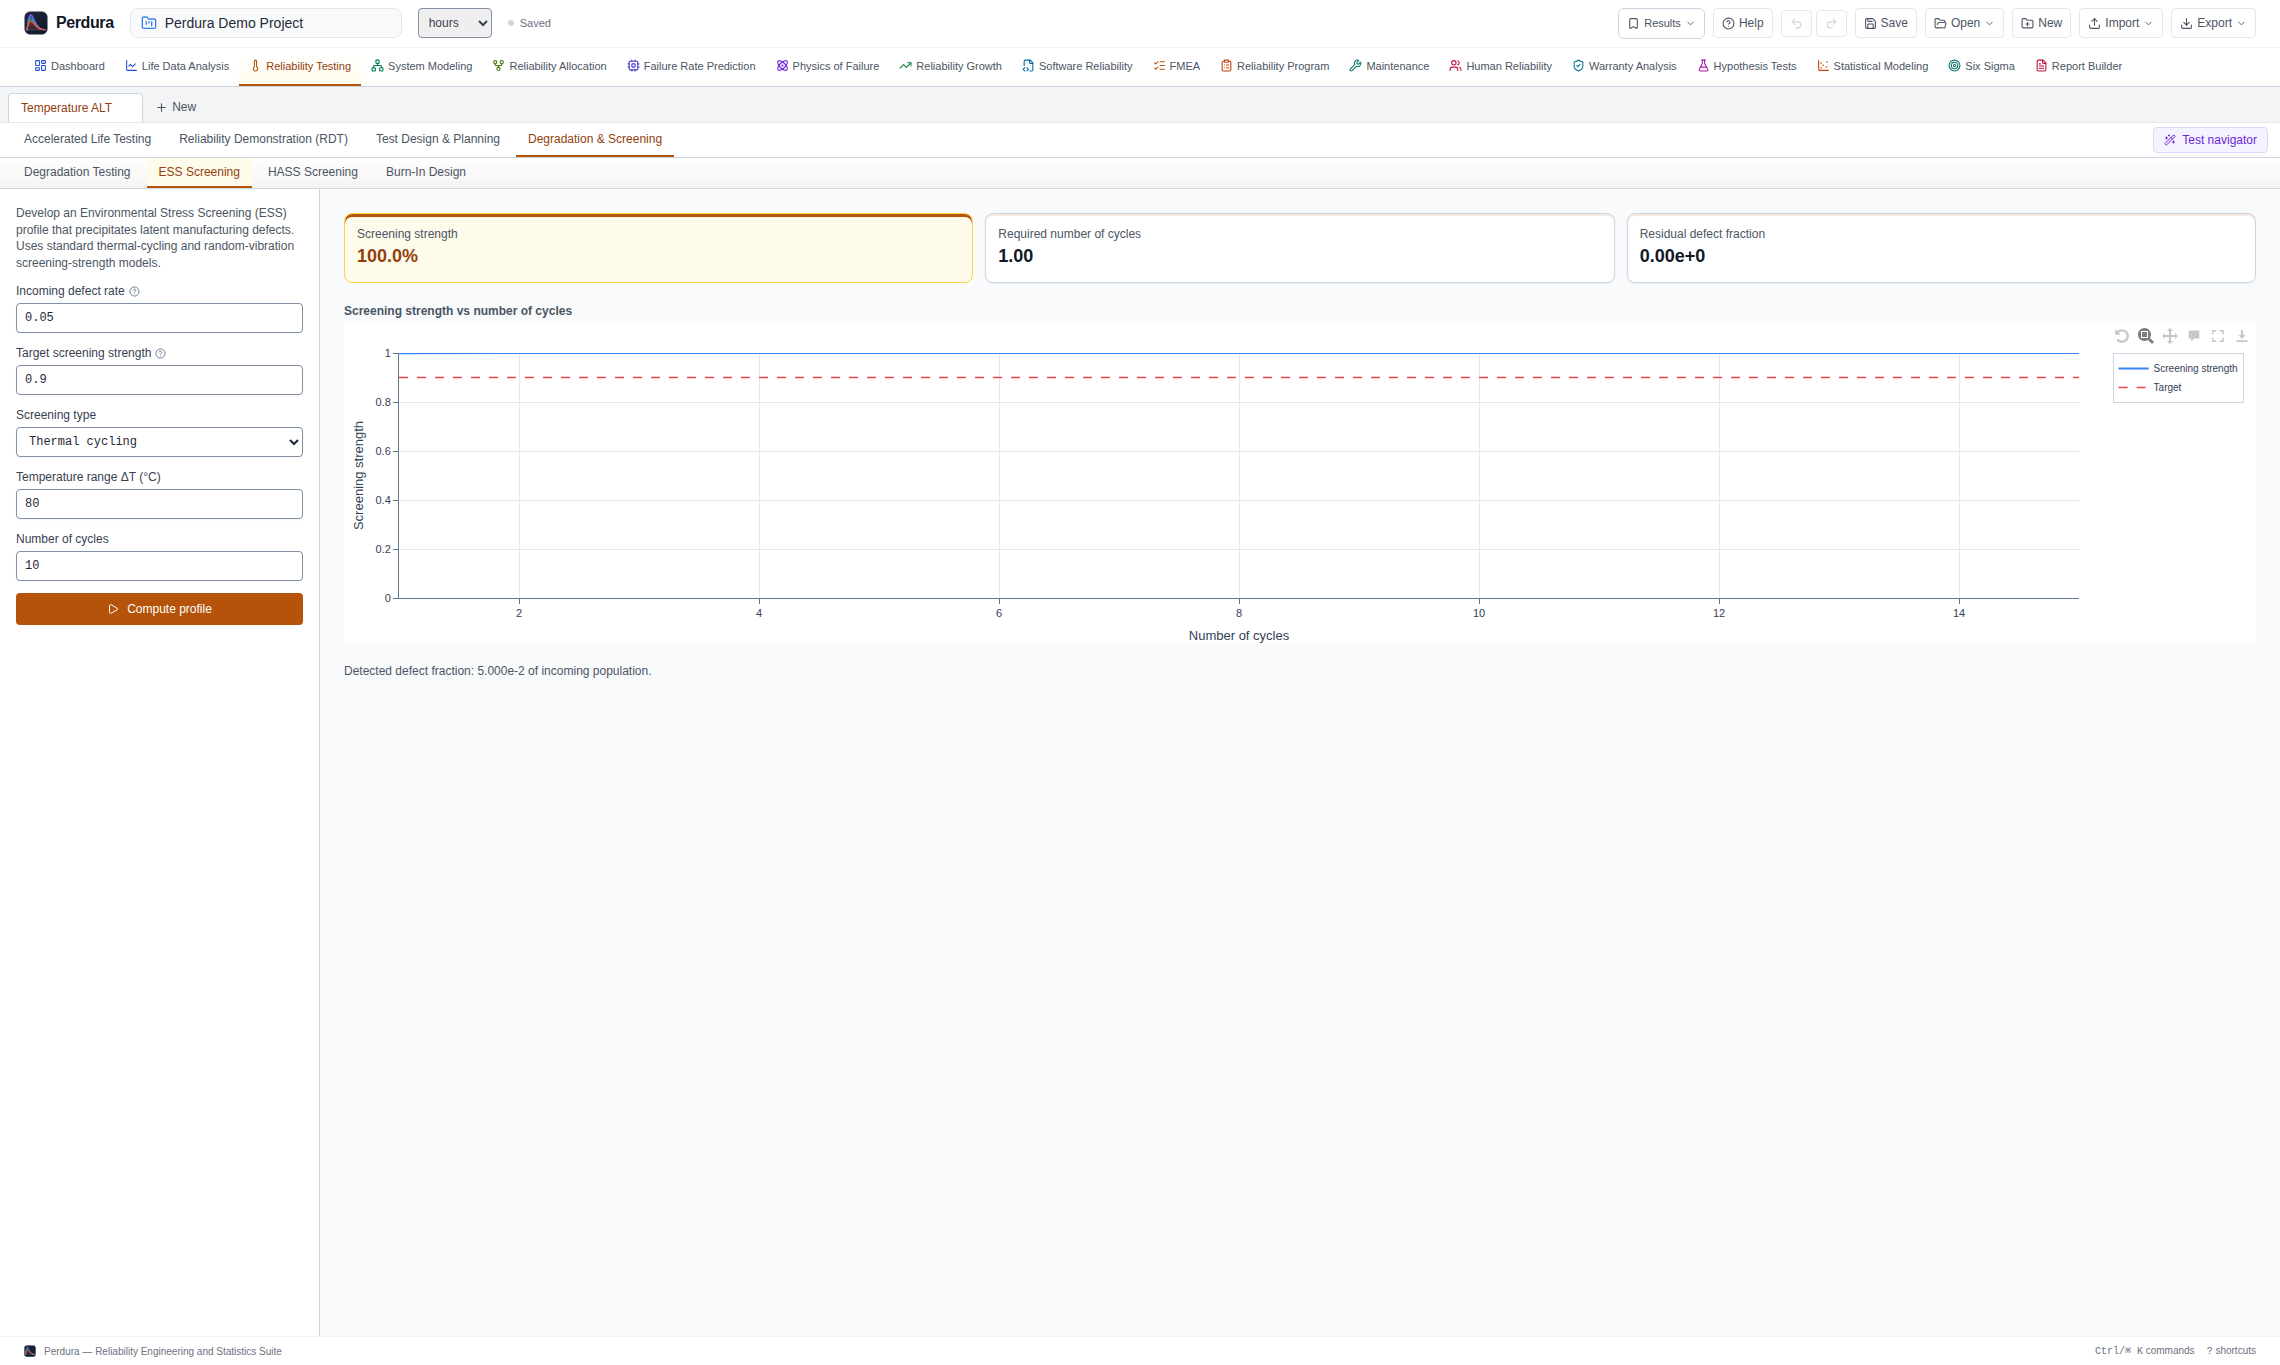
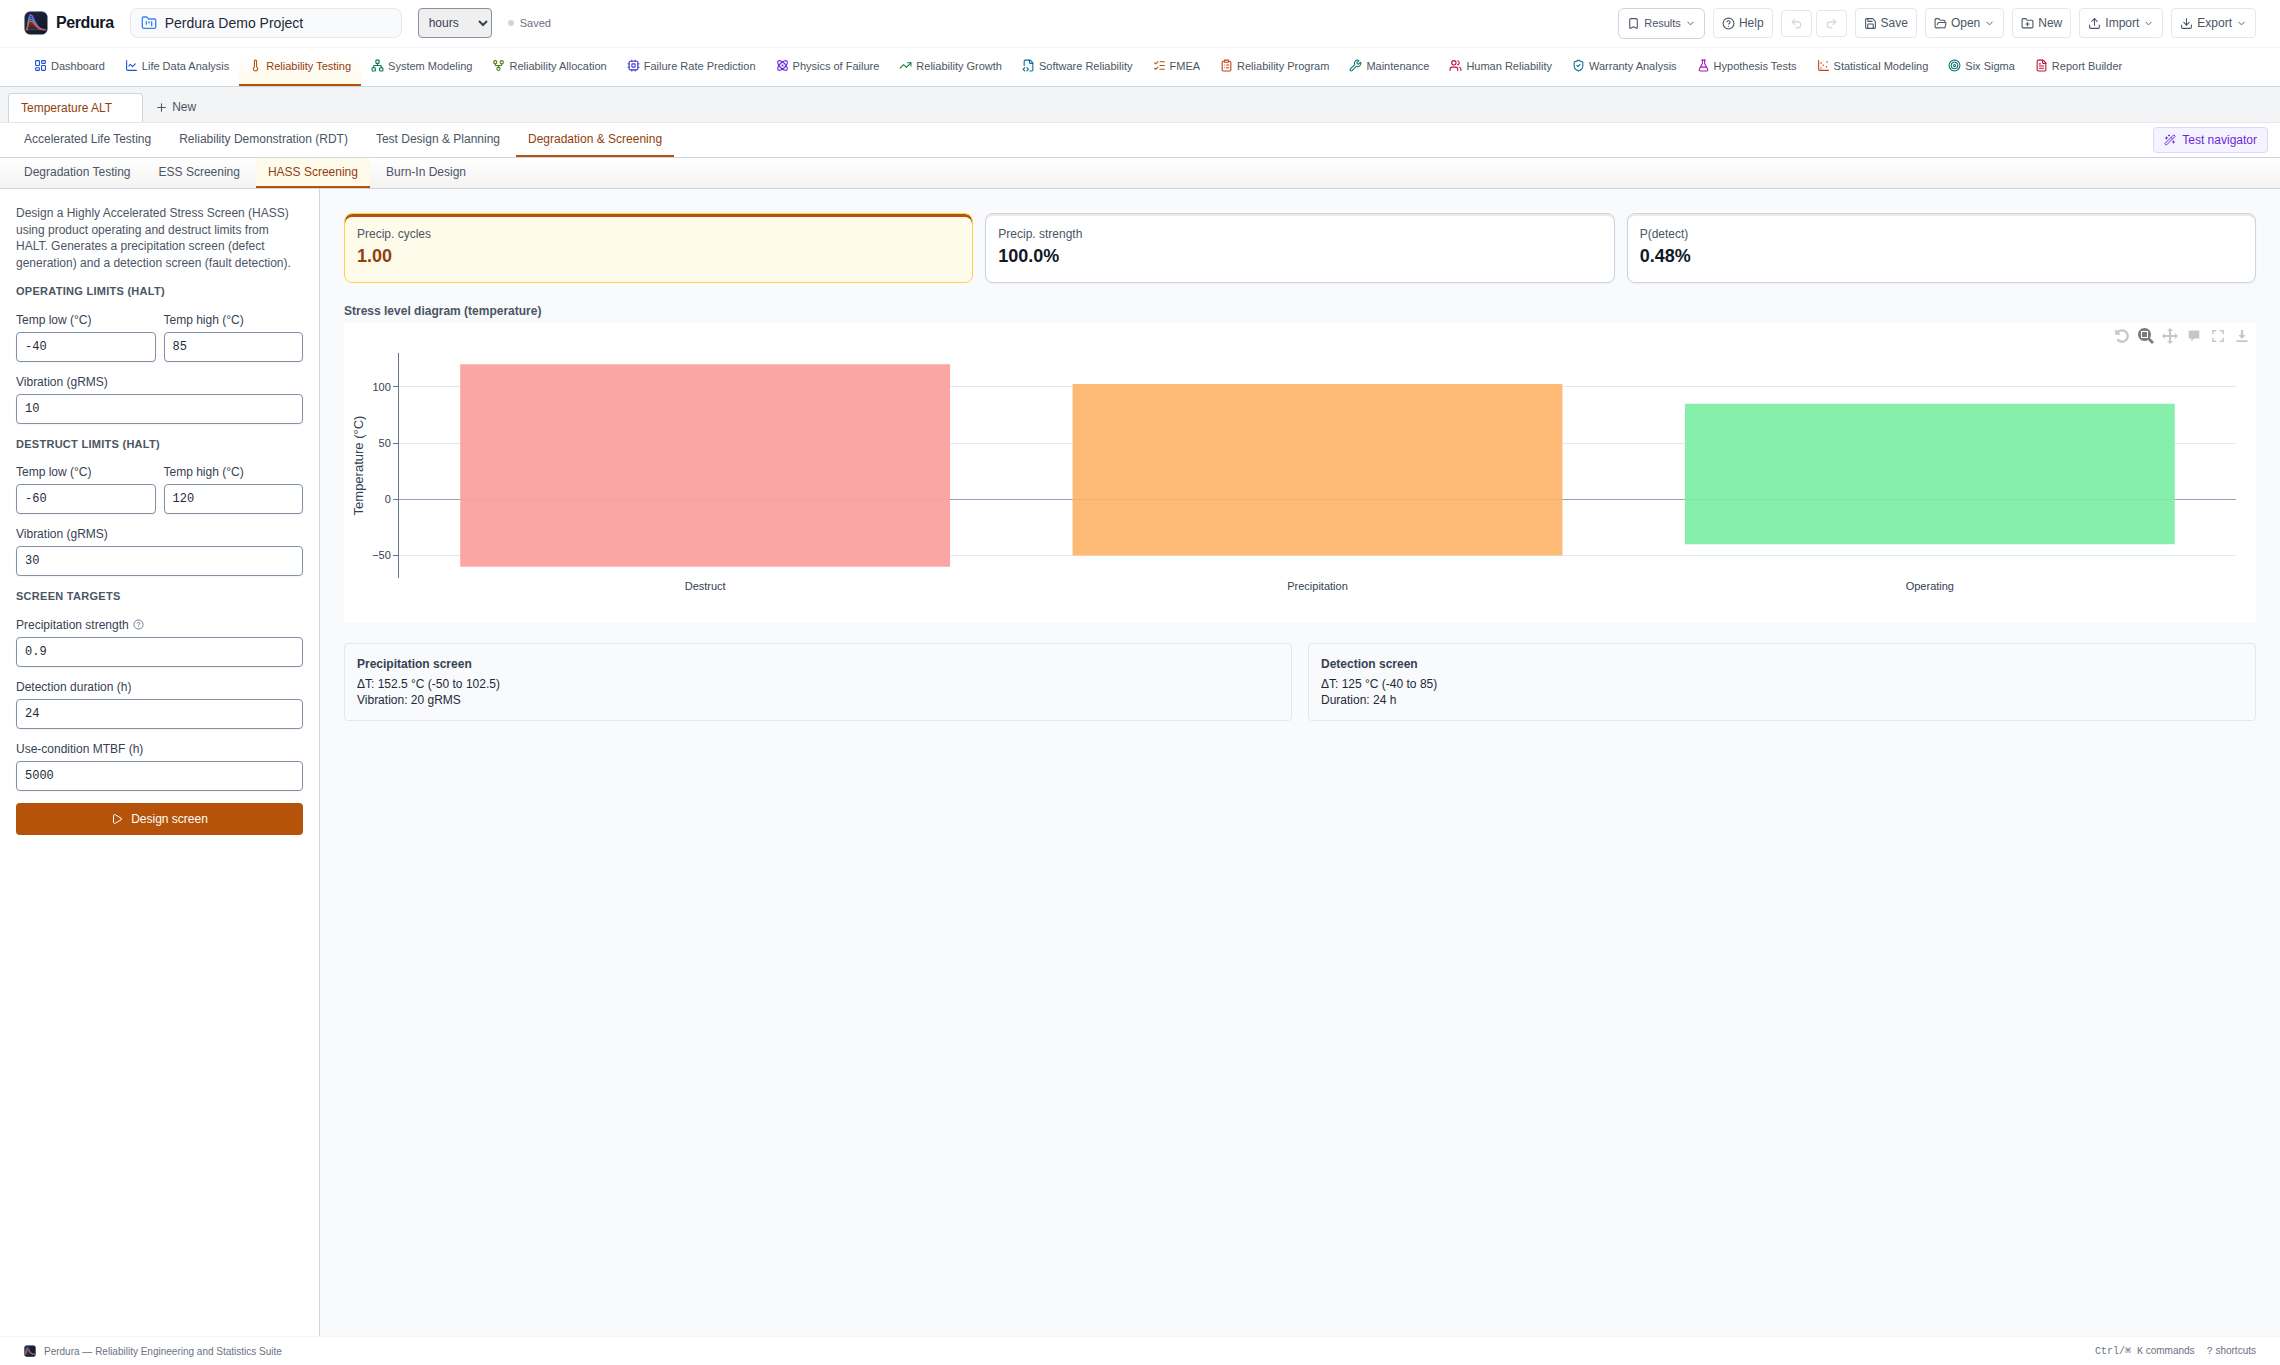
Degradation Analysis & Screening
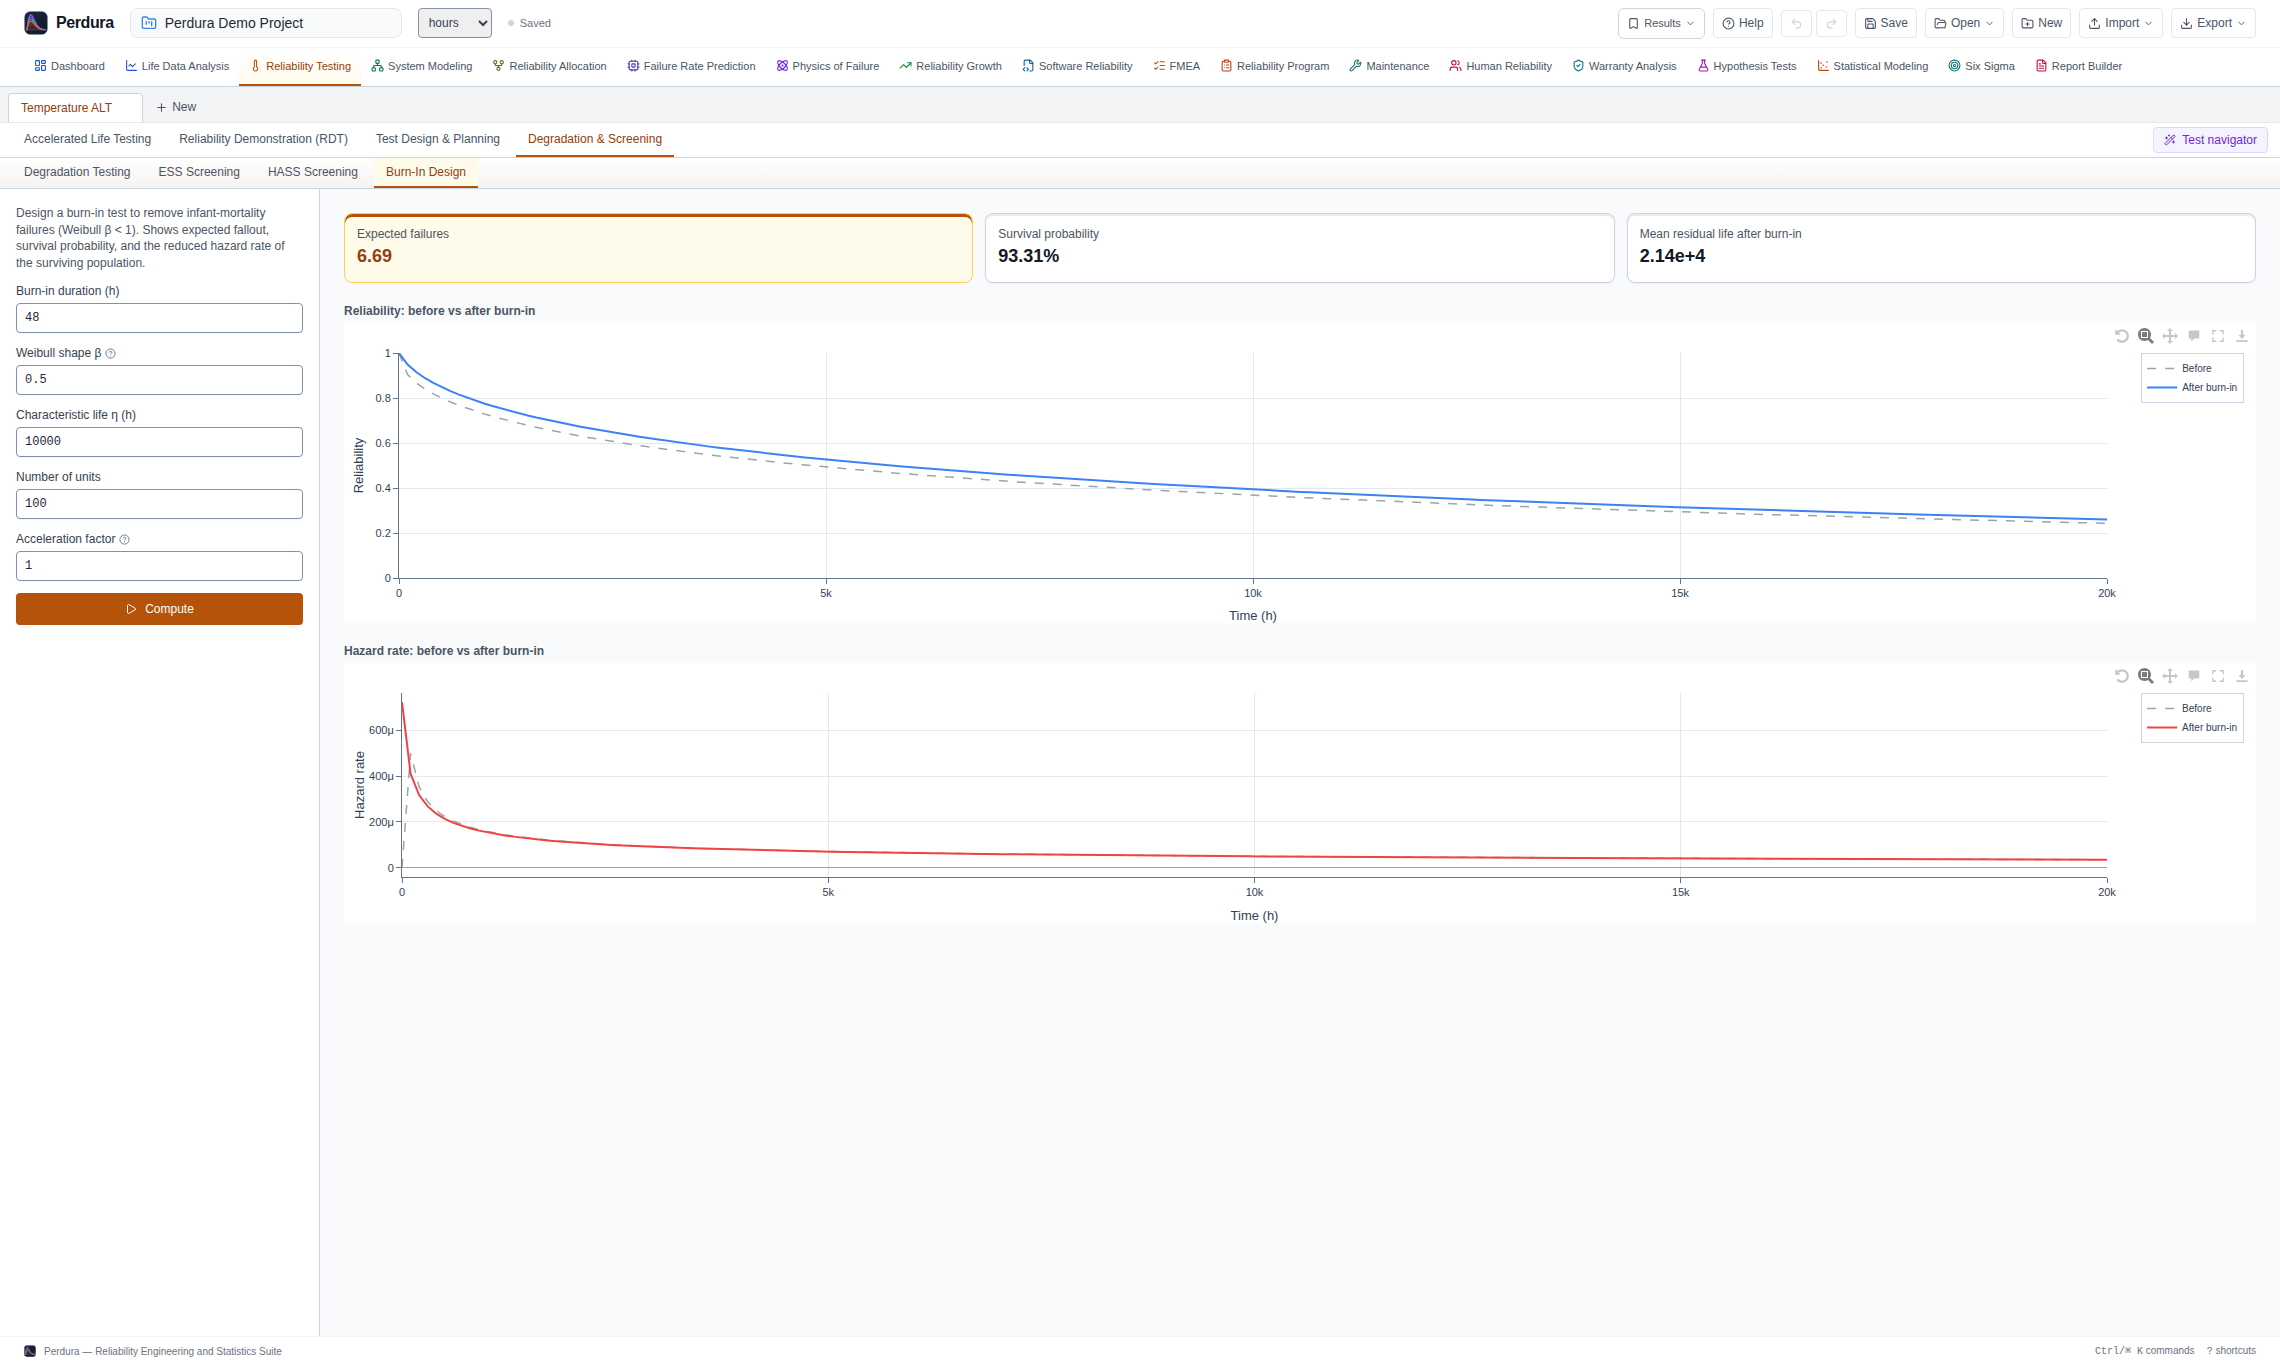
Plan degradation, ESS, HASS and burn-in studies against defined failure thresholds.
- Non-destructive repeated-measure degradation paths extrapolated to a defined failure criterion
- Destructive degradation analysis using location-parameter-versus-time MLE
- Environmental stress screening (ESS) and highly accelerated stress screening (HASS) design
- Burn-in duration planning with reliability-improvement and cost tradeoffs
Statistical Modeling
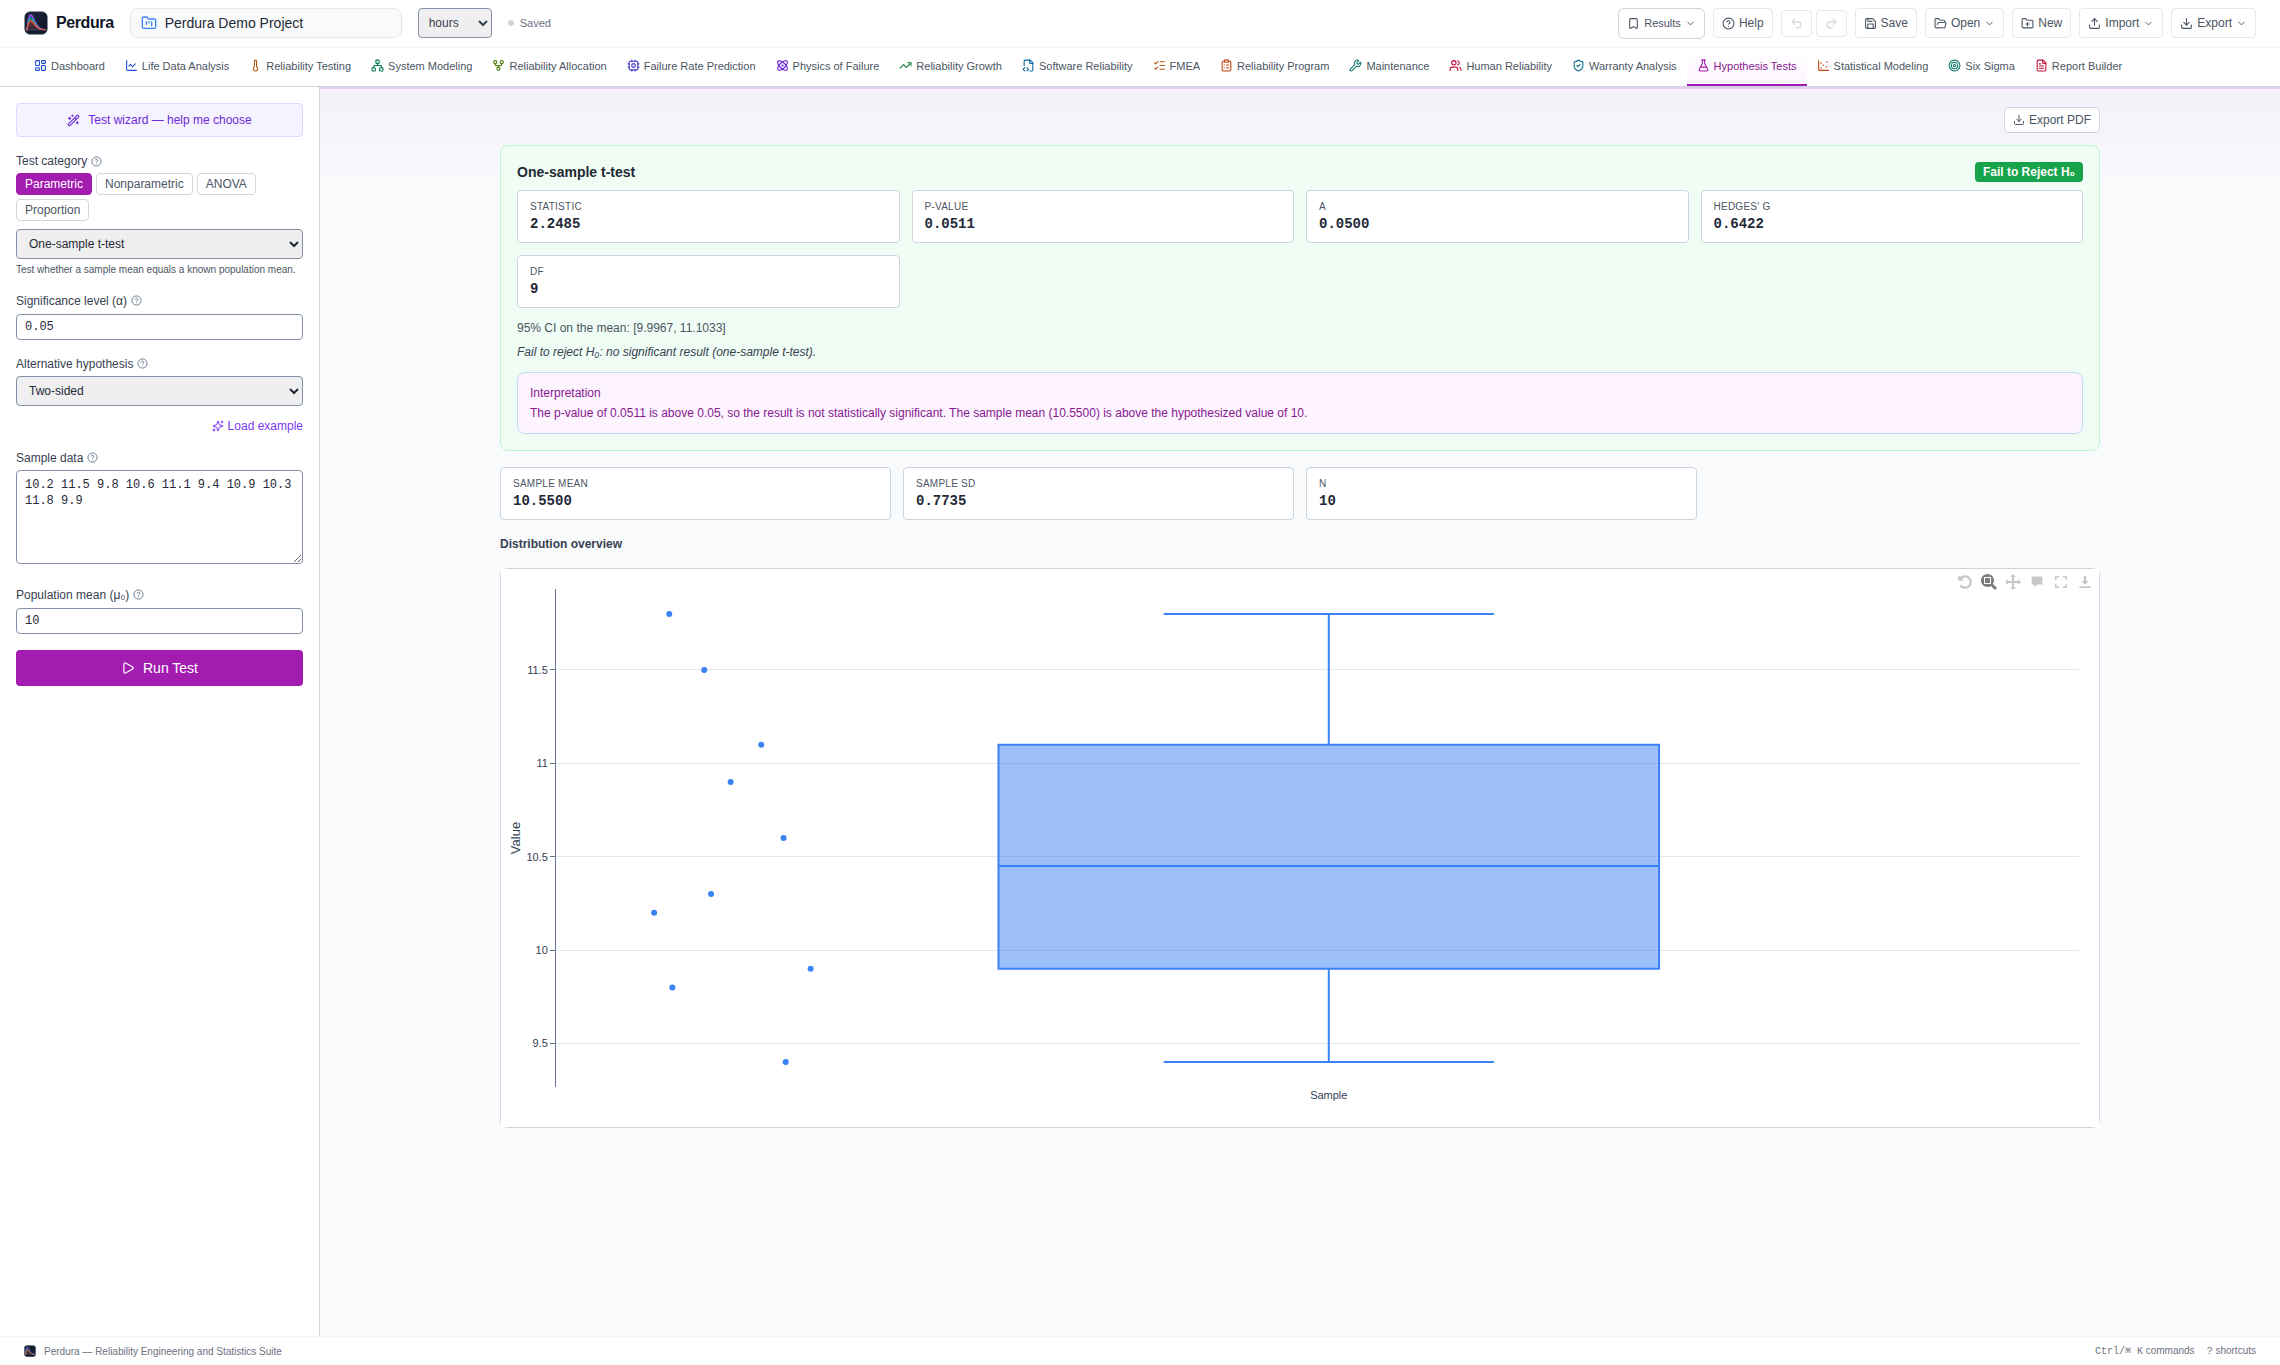
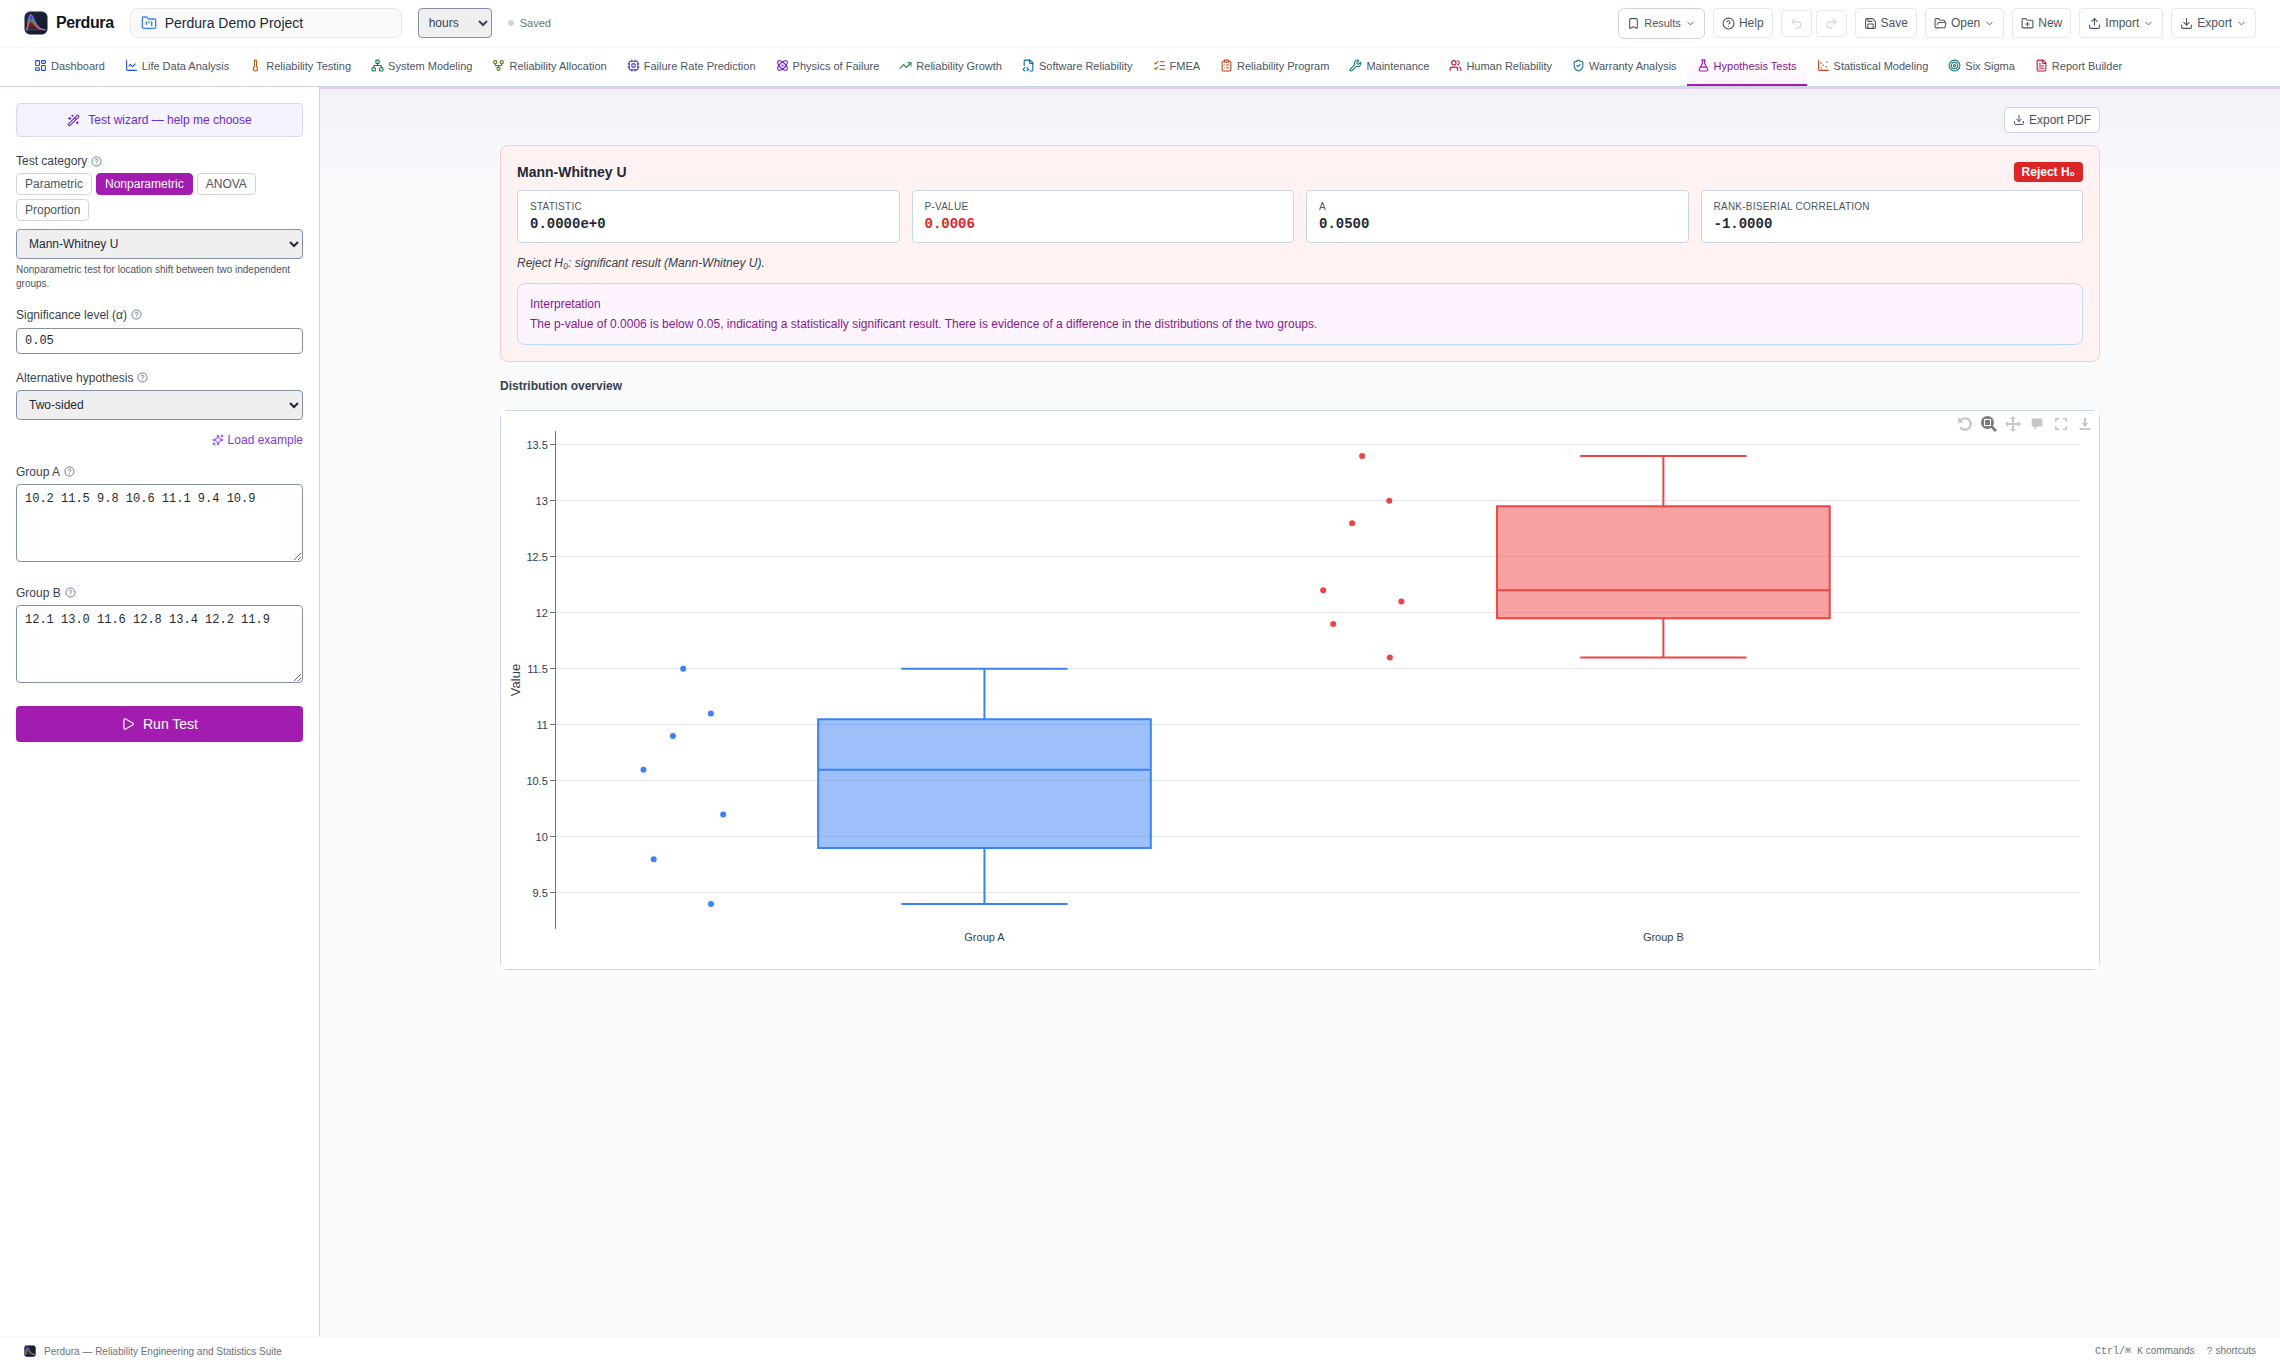
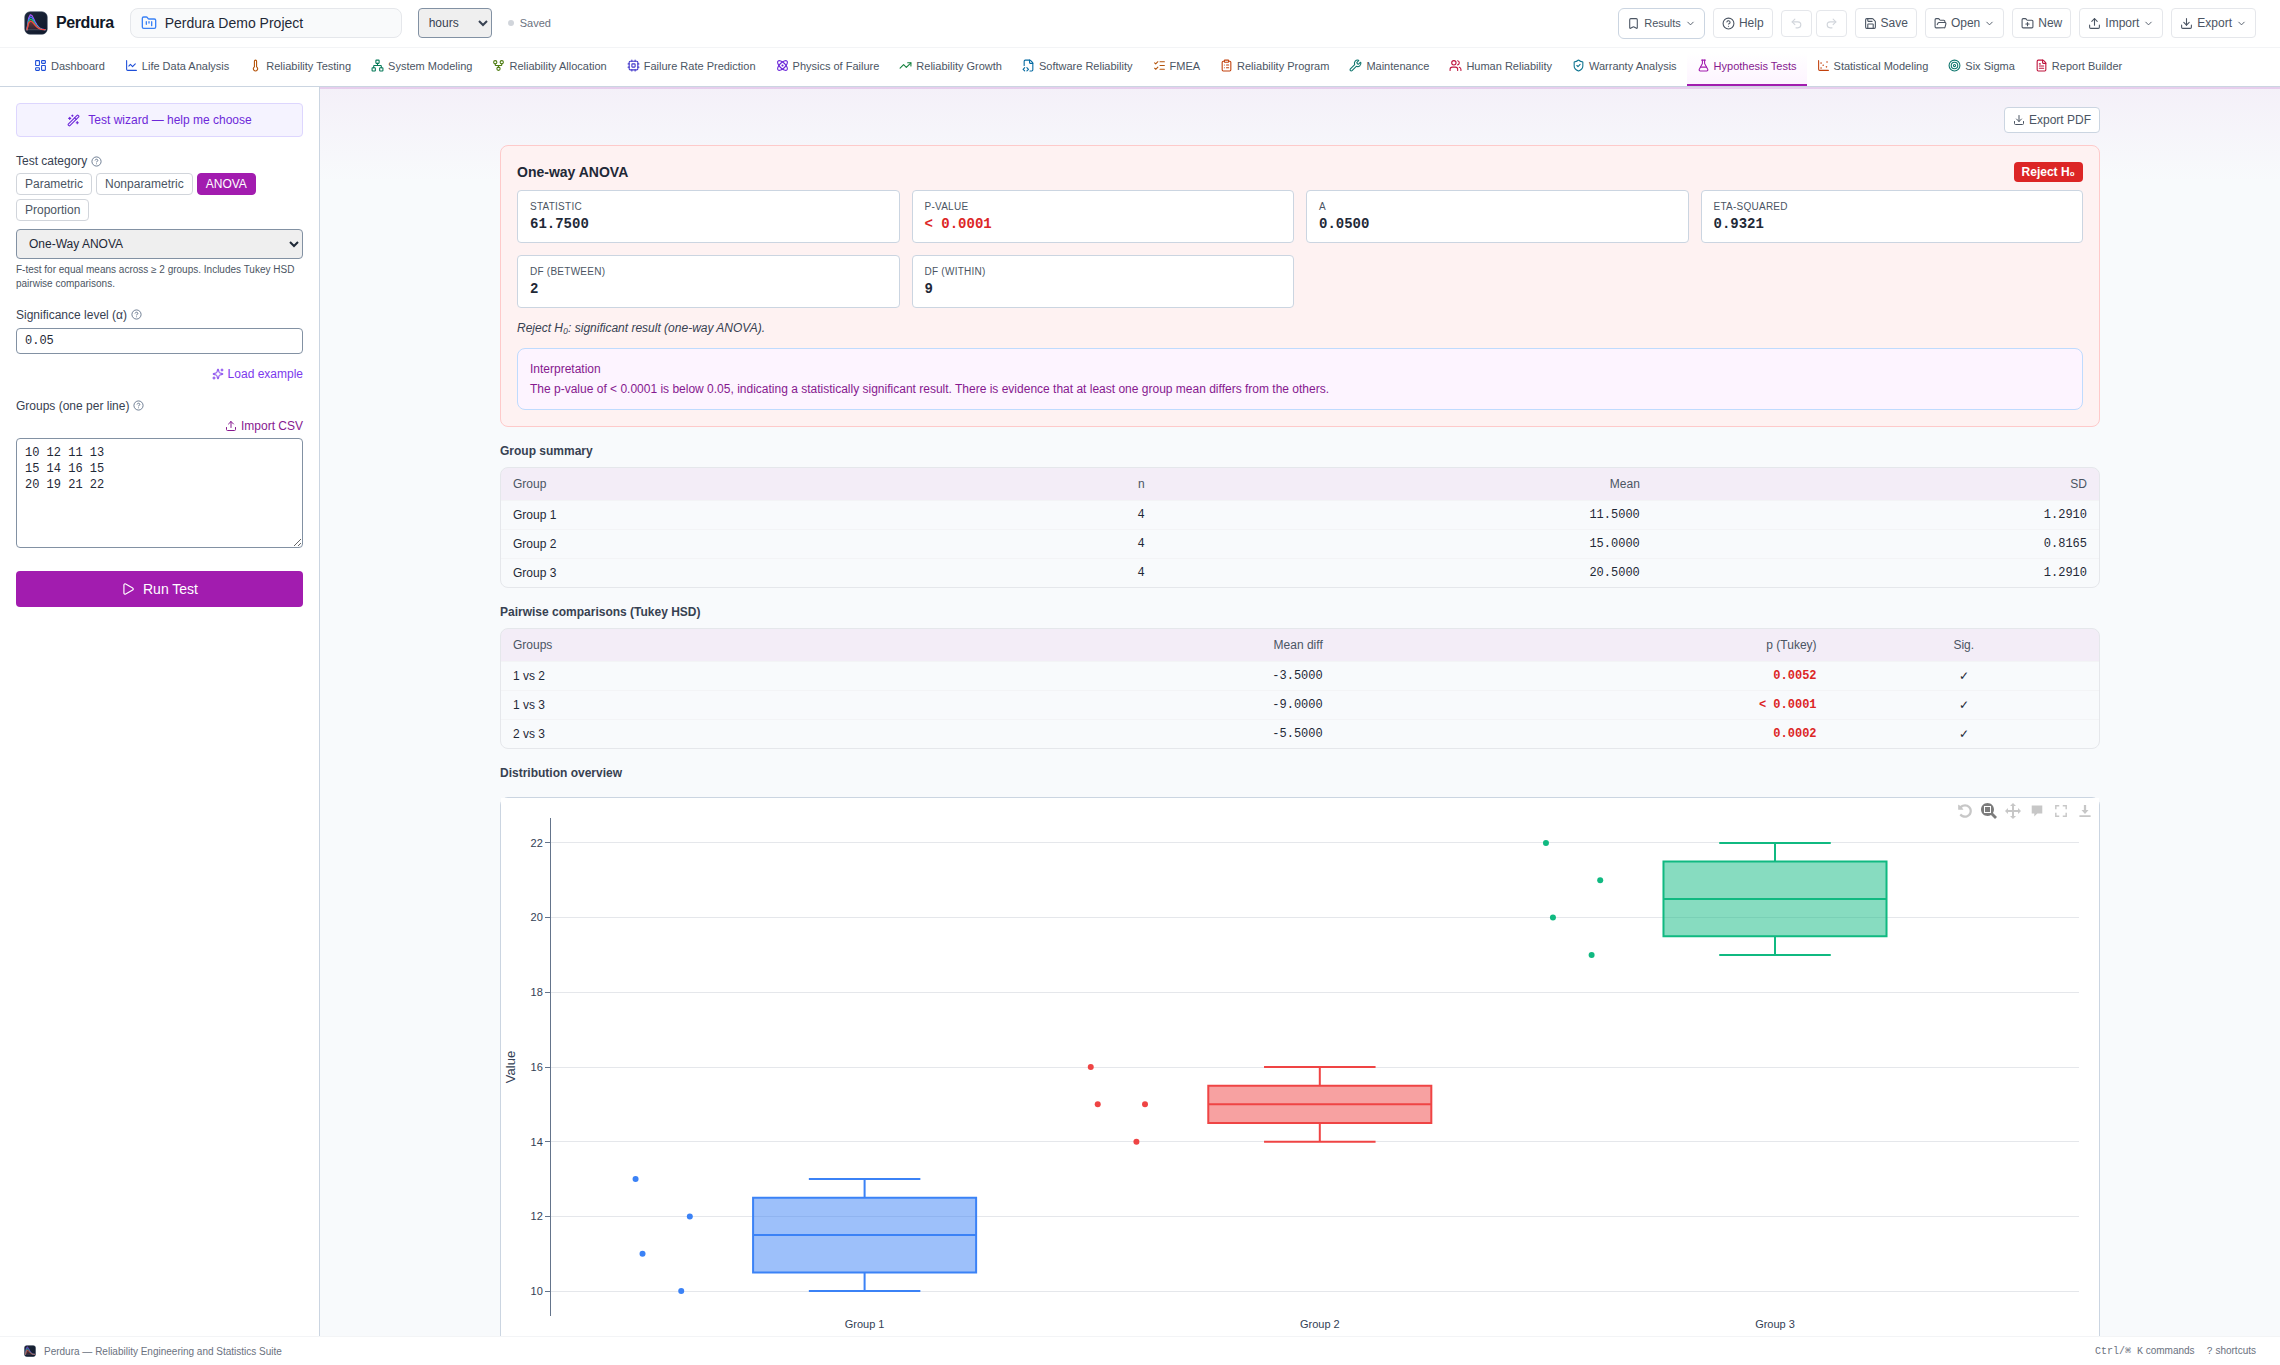
Characterize data, test stated hypotheses and compare predictive models under explicit evaluation rules.
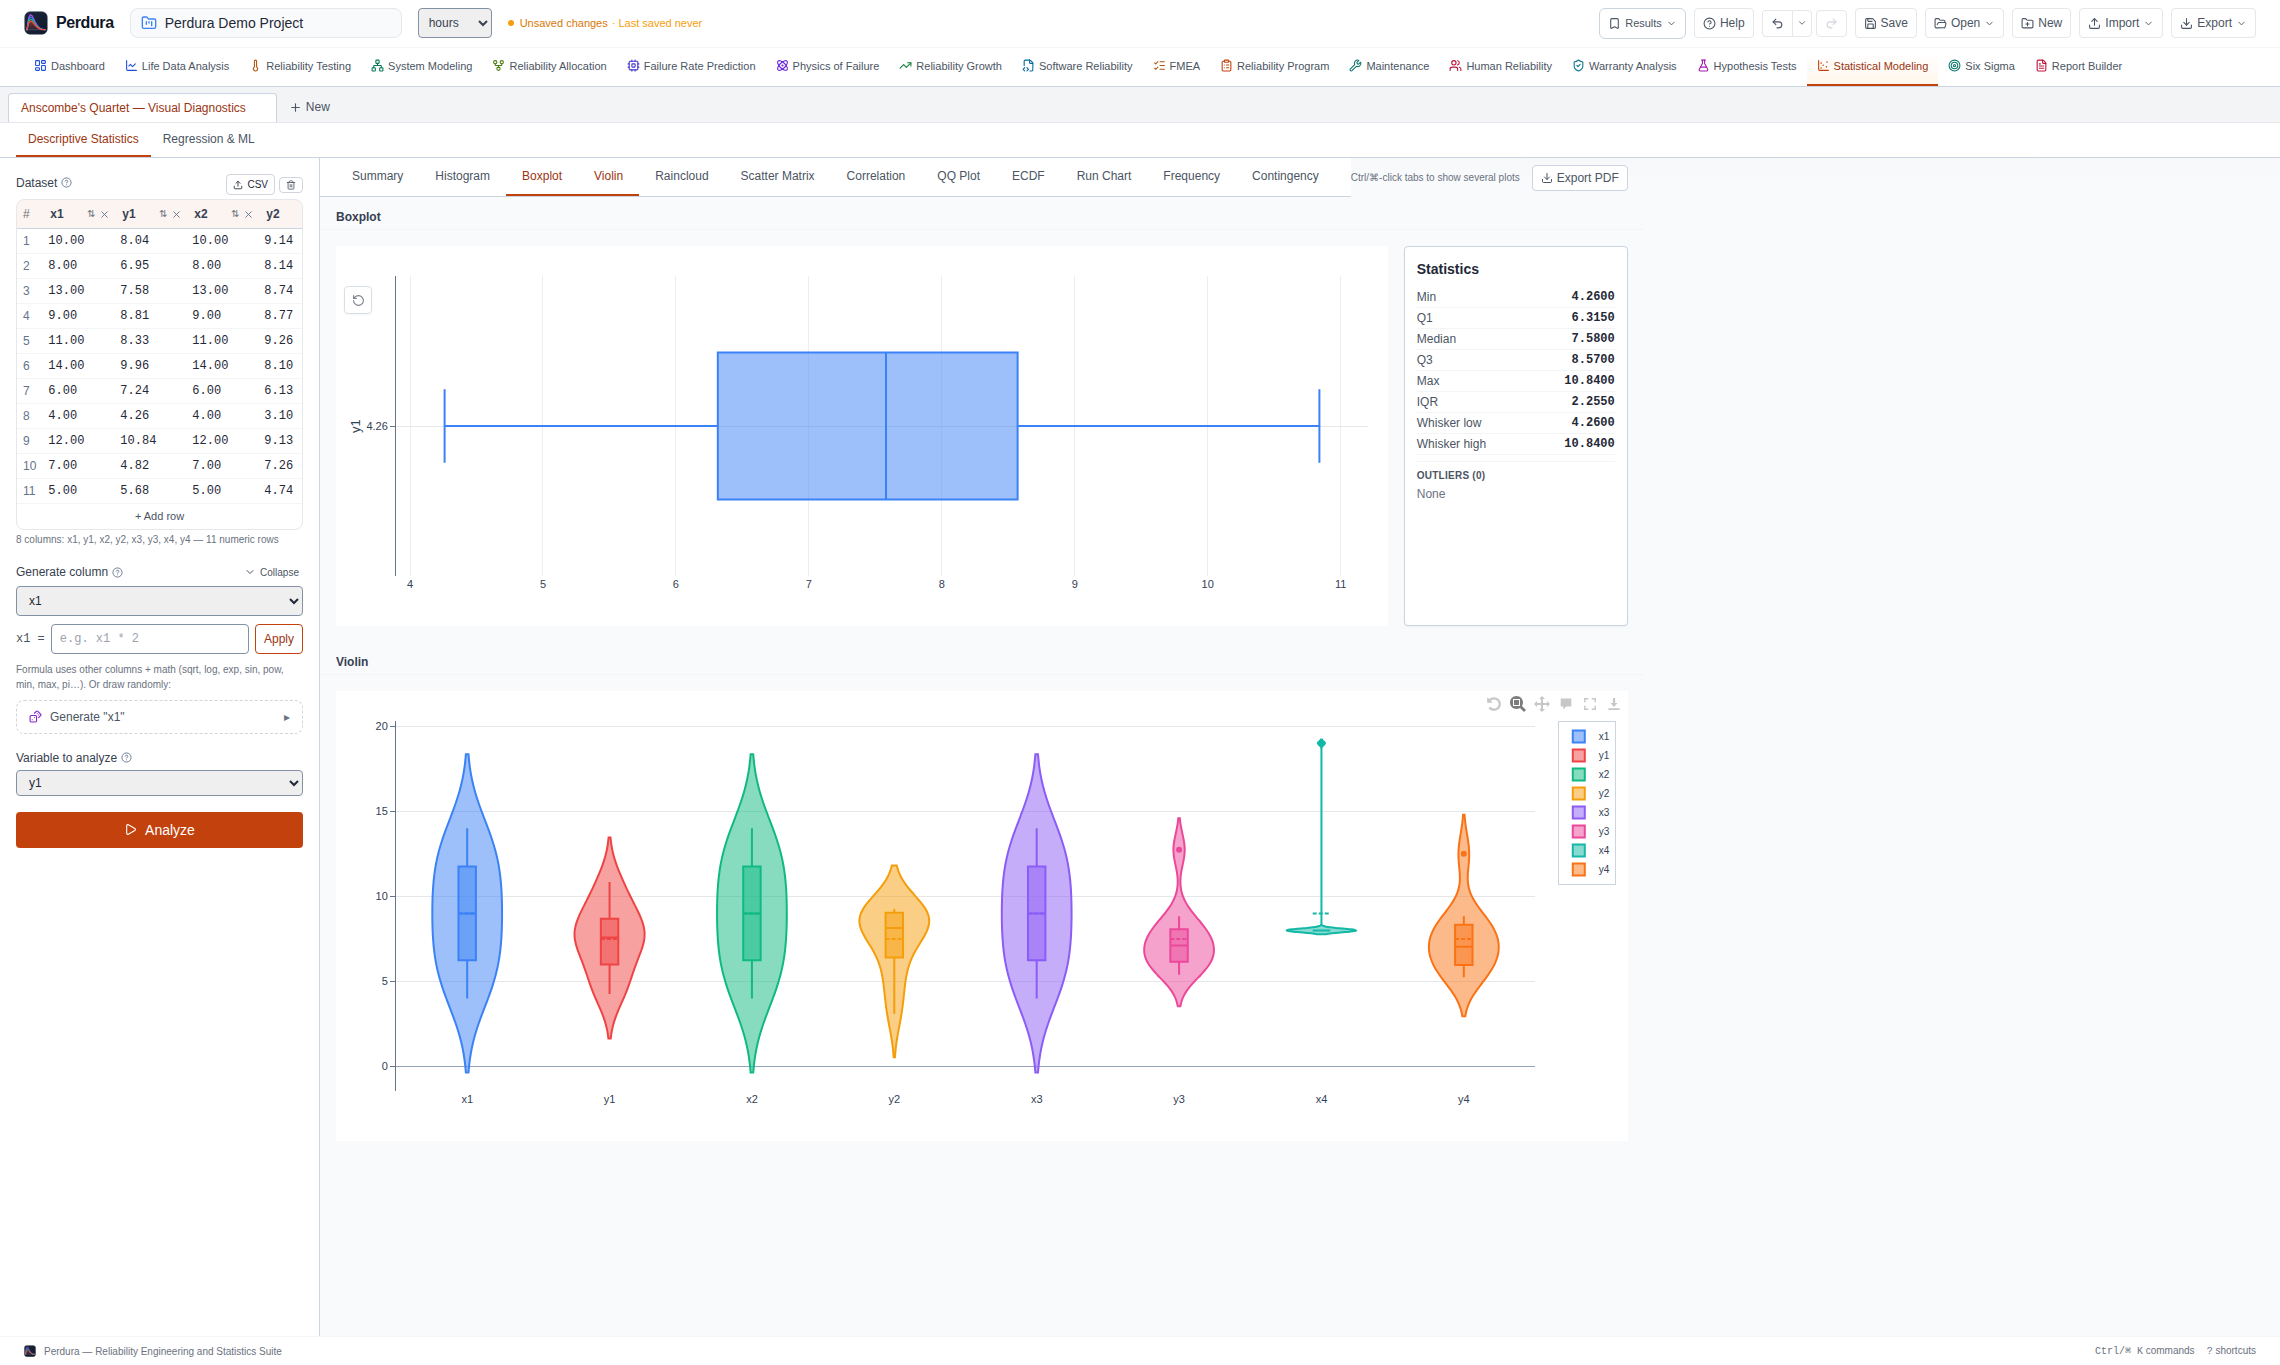
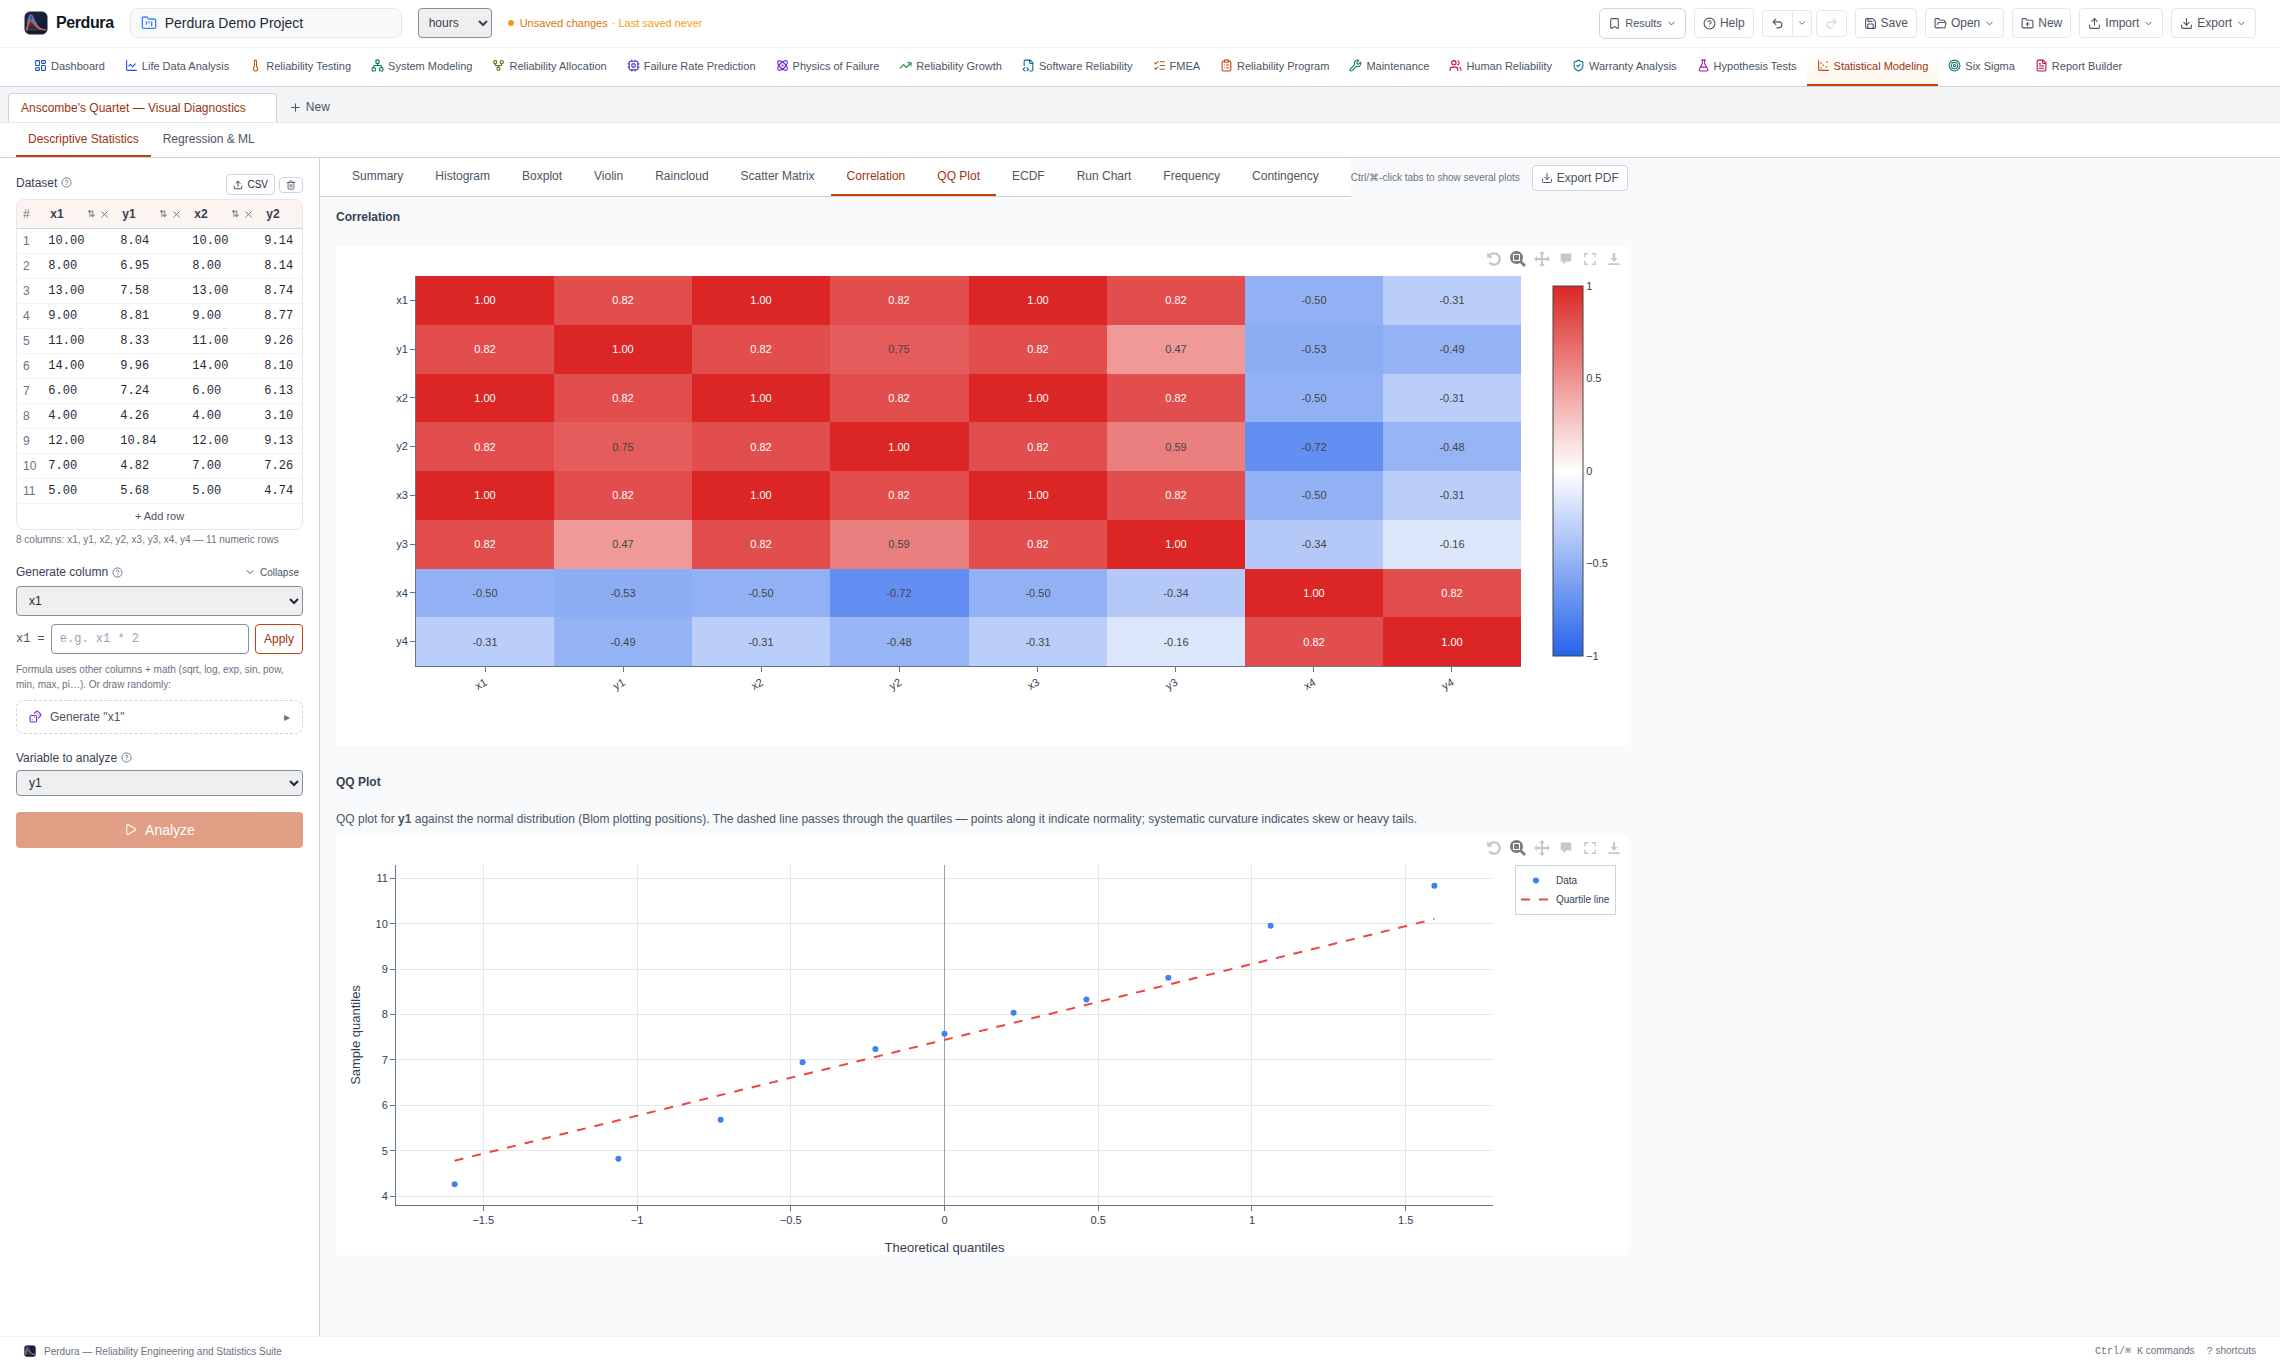
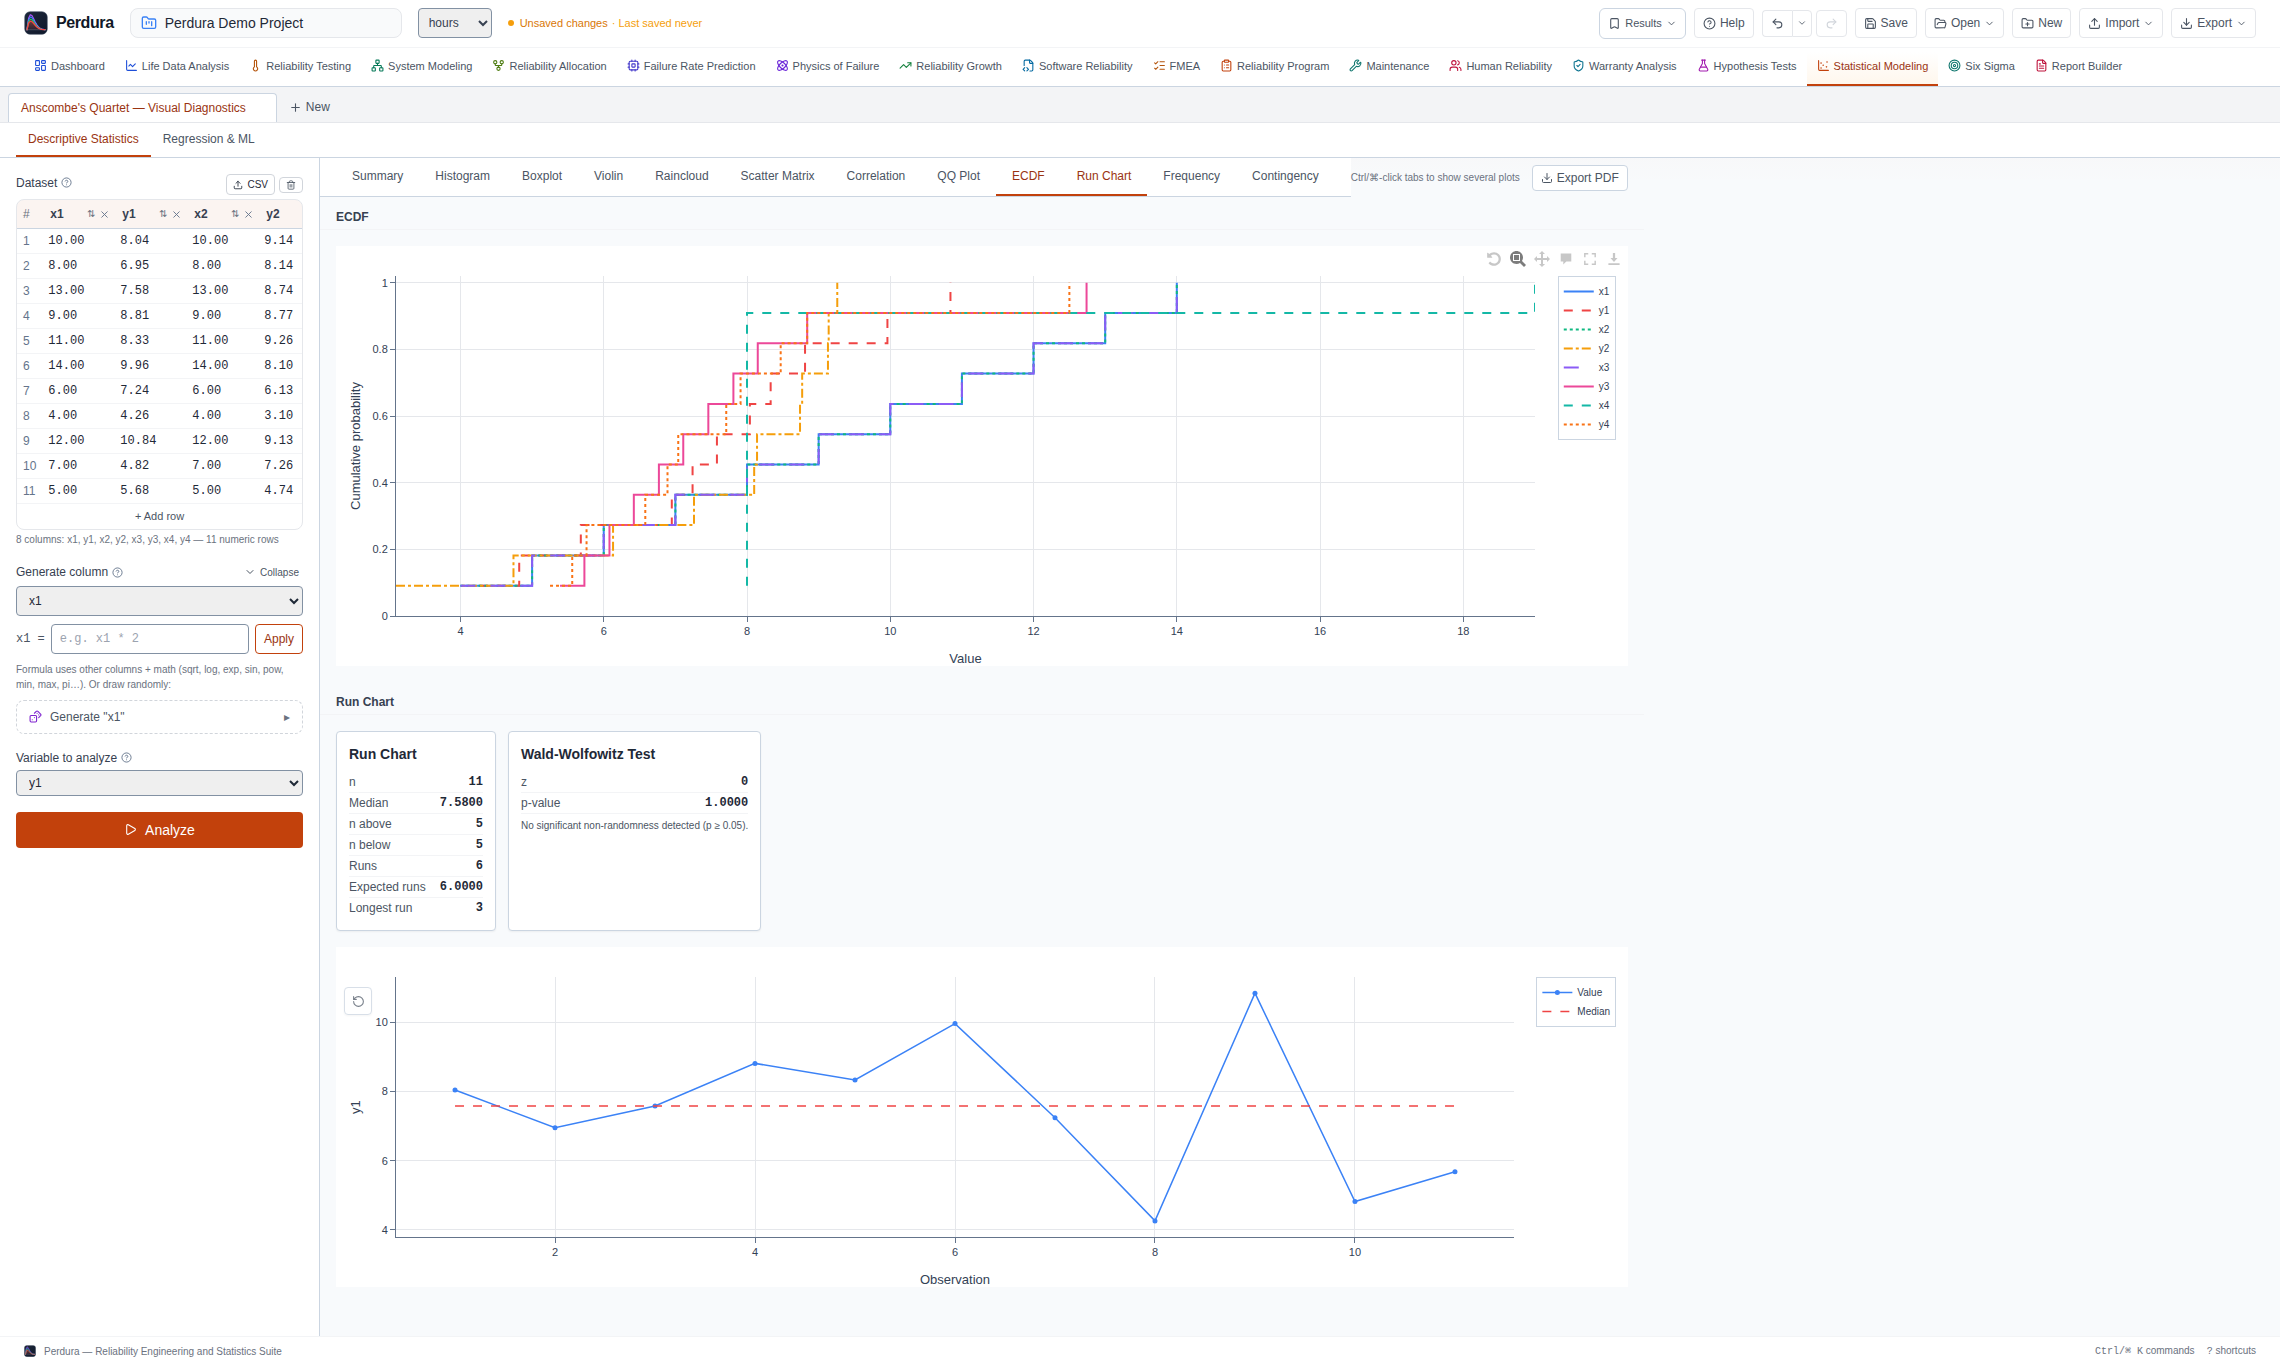
- Data summary and reporting with run, box, violin and raincloud plots, scatter matrices and correlation heatmaps
- Regression & ML: linear, polynomial, regularized, logistic, tree/ensemble, SVM, KNN and neural-network candidates
- Out-of-sample candidate comparison, residual diagnostics, interpretation, finalization and batch CSV scoring
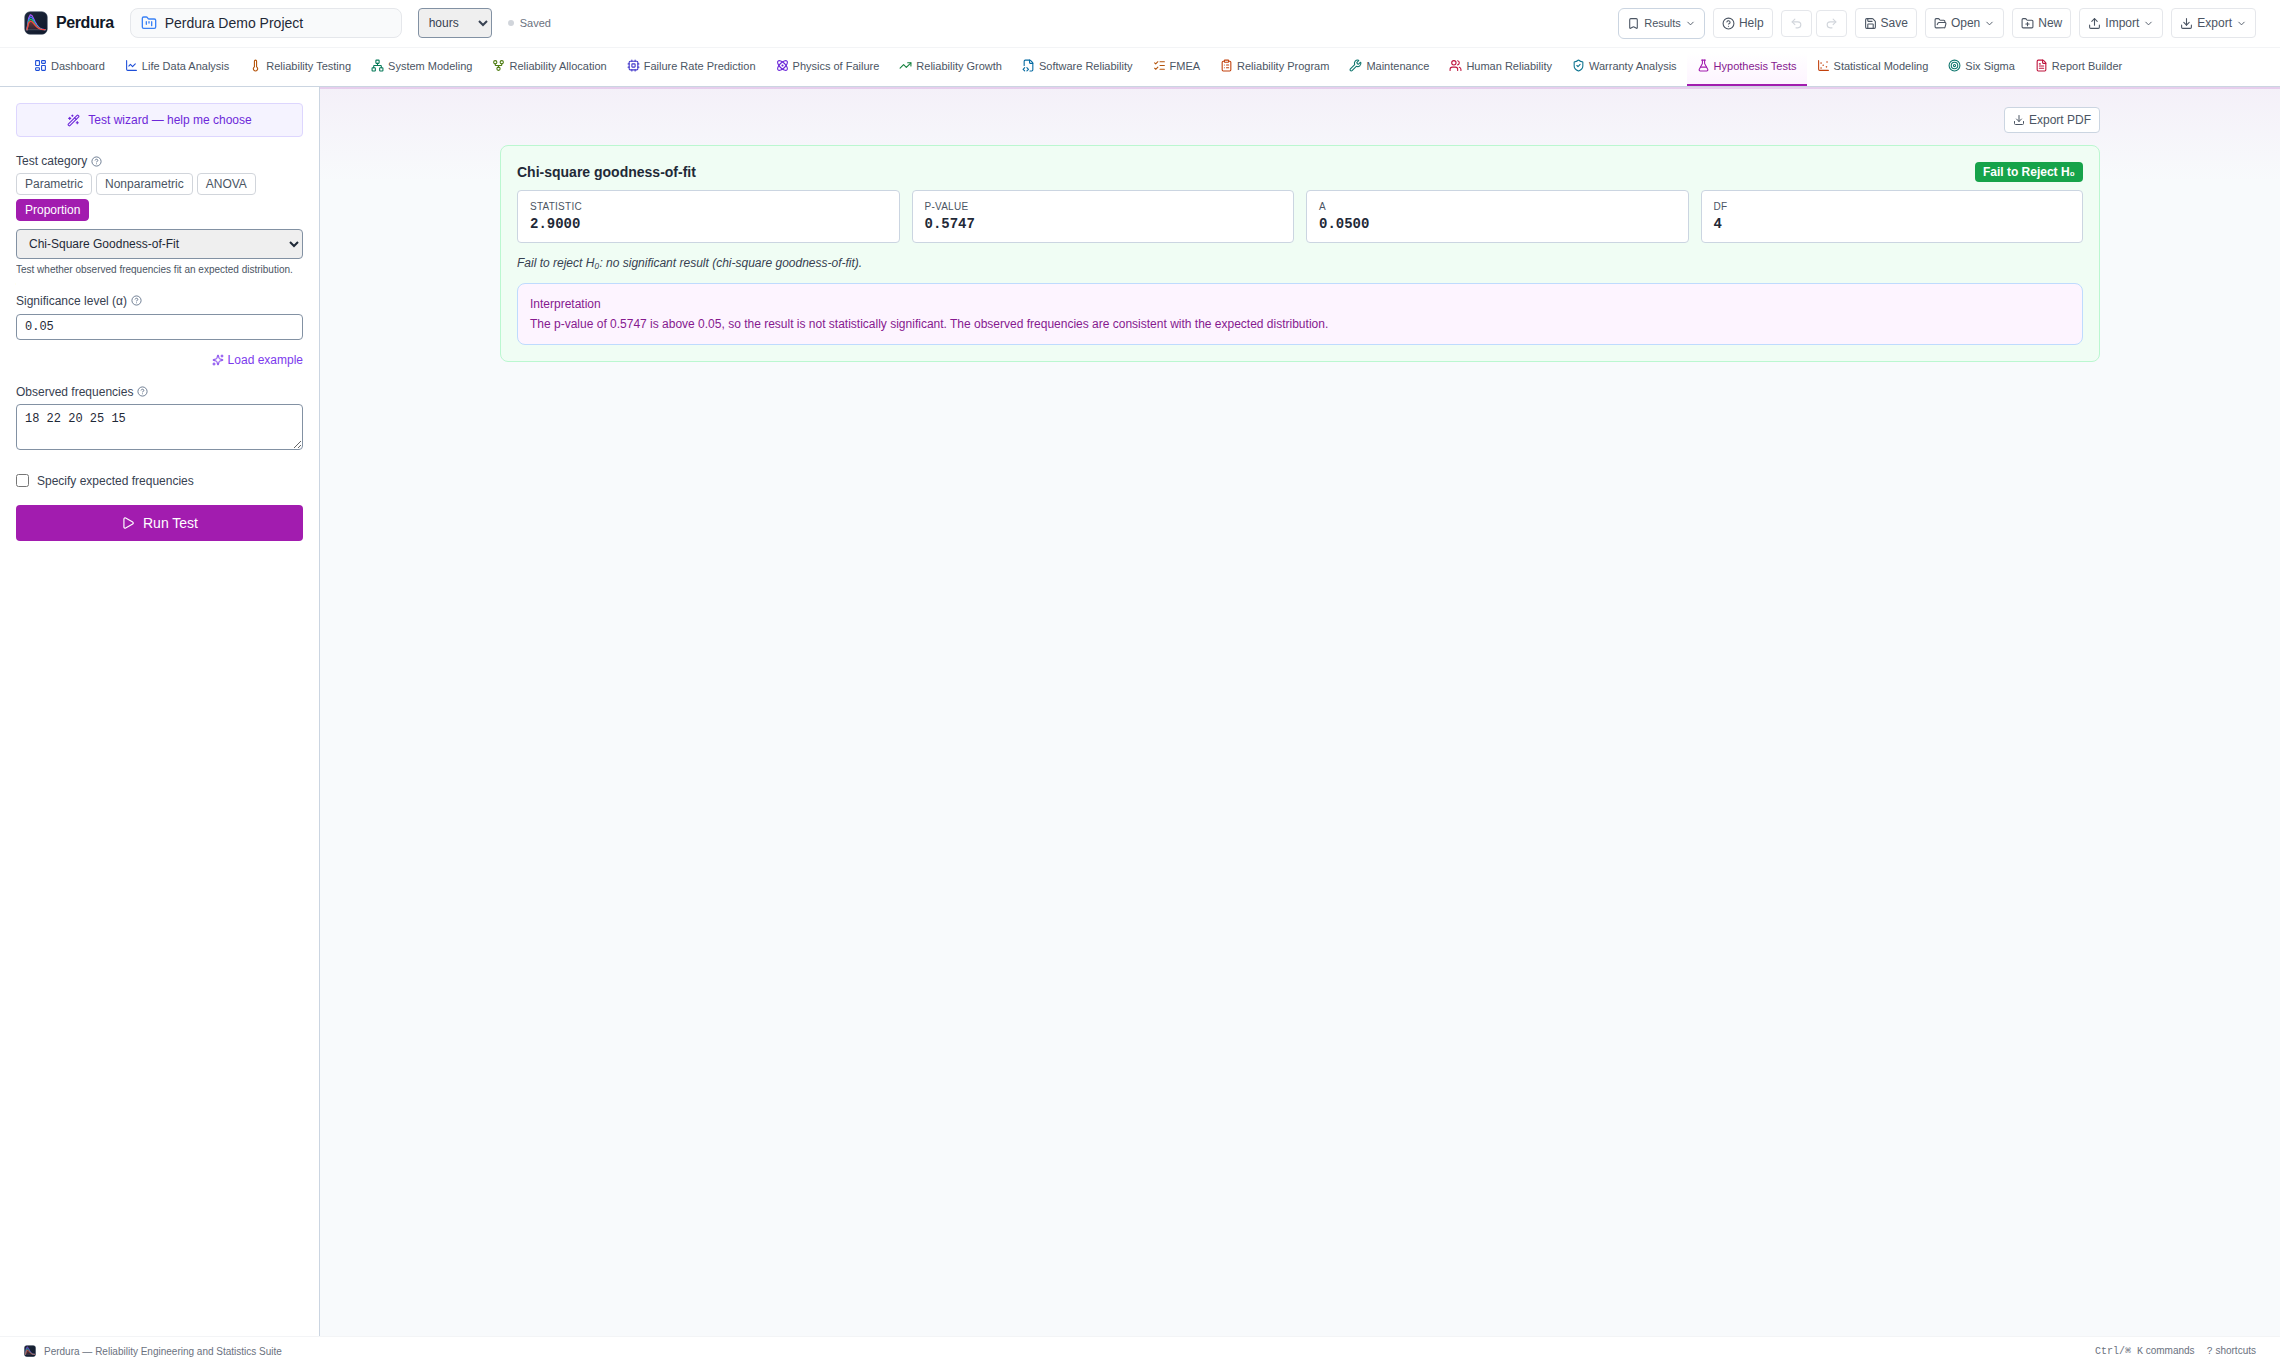
- t-tests, ANOVA (including mixed and repeated-measures), chi-square and non-parametric tests
- Analysis-state monitoring identifies results that no longer match the underlying data
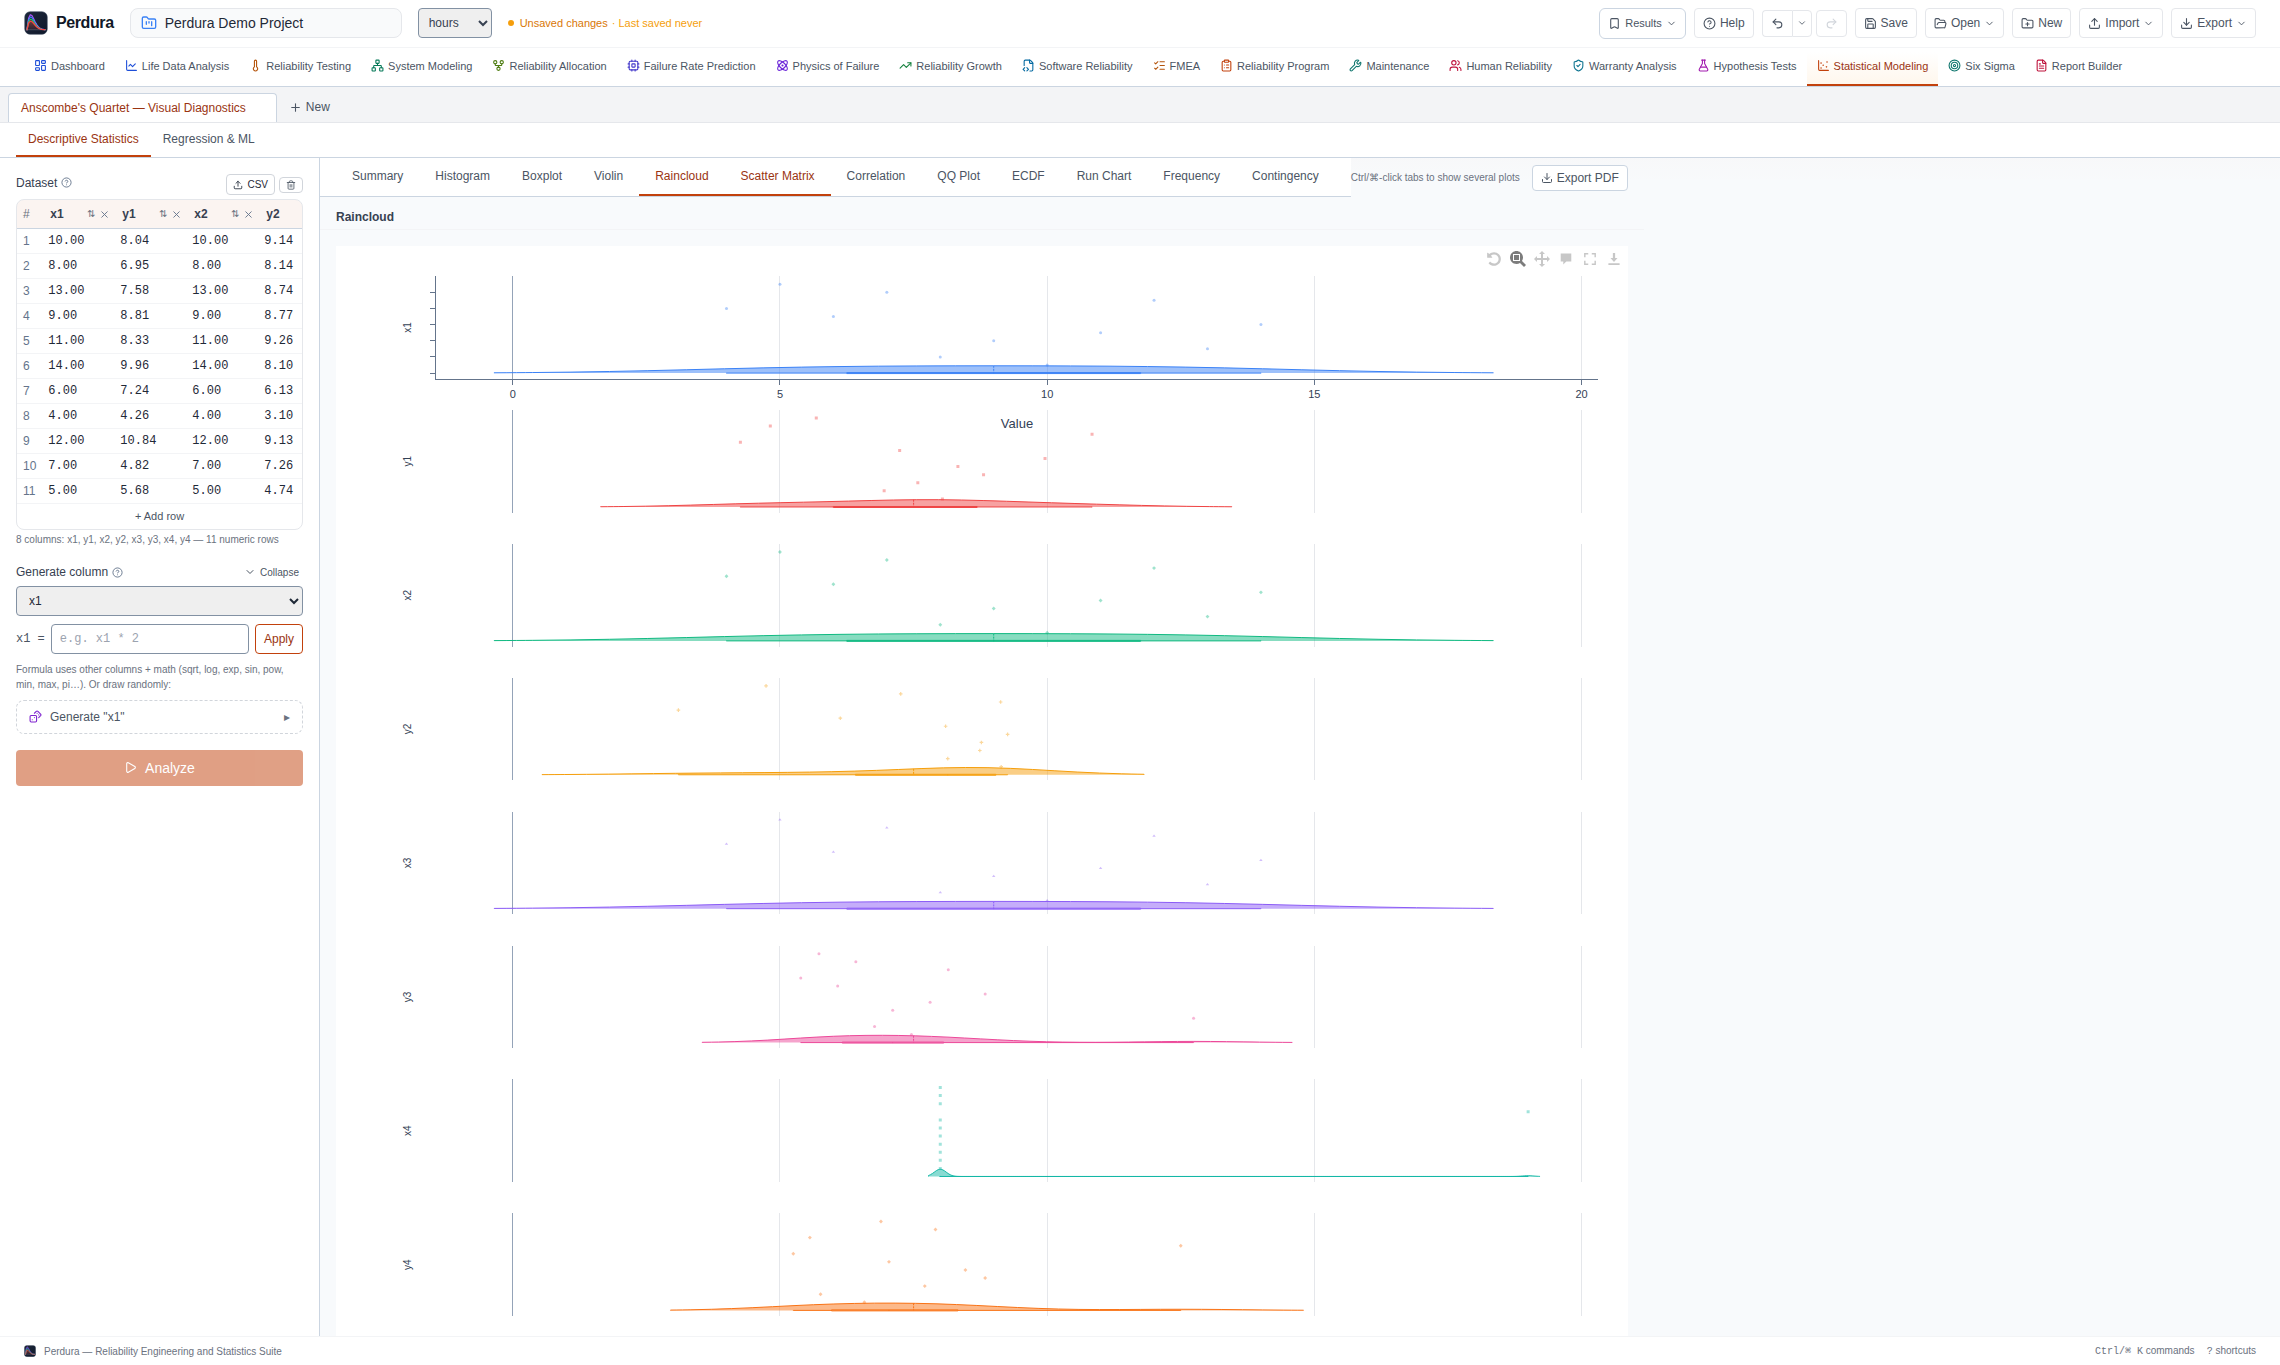
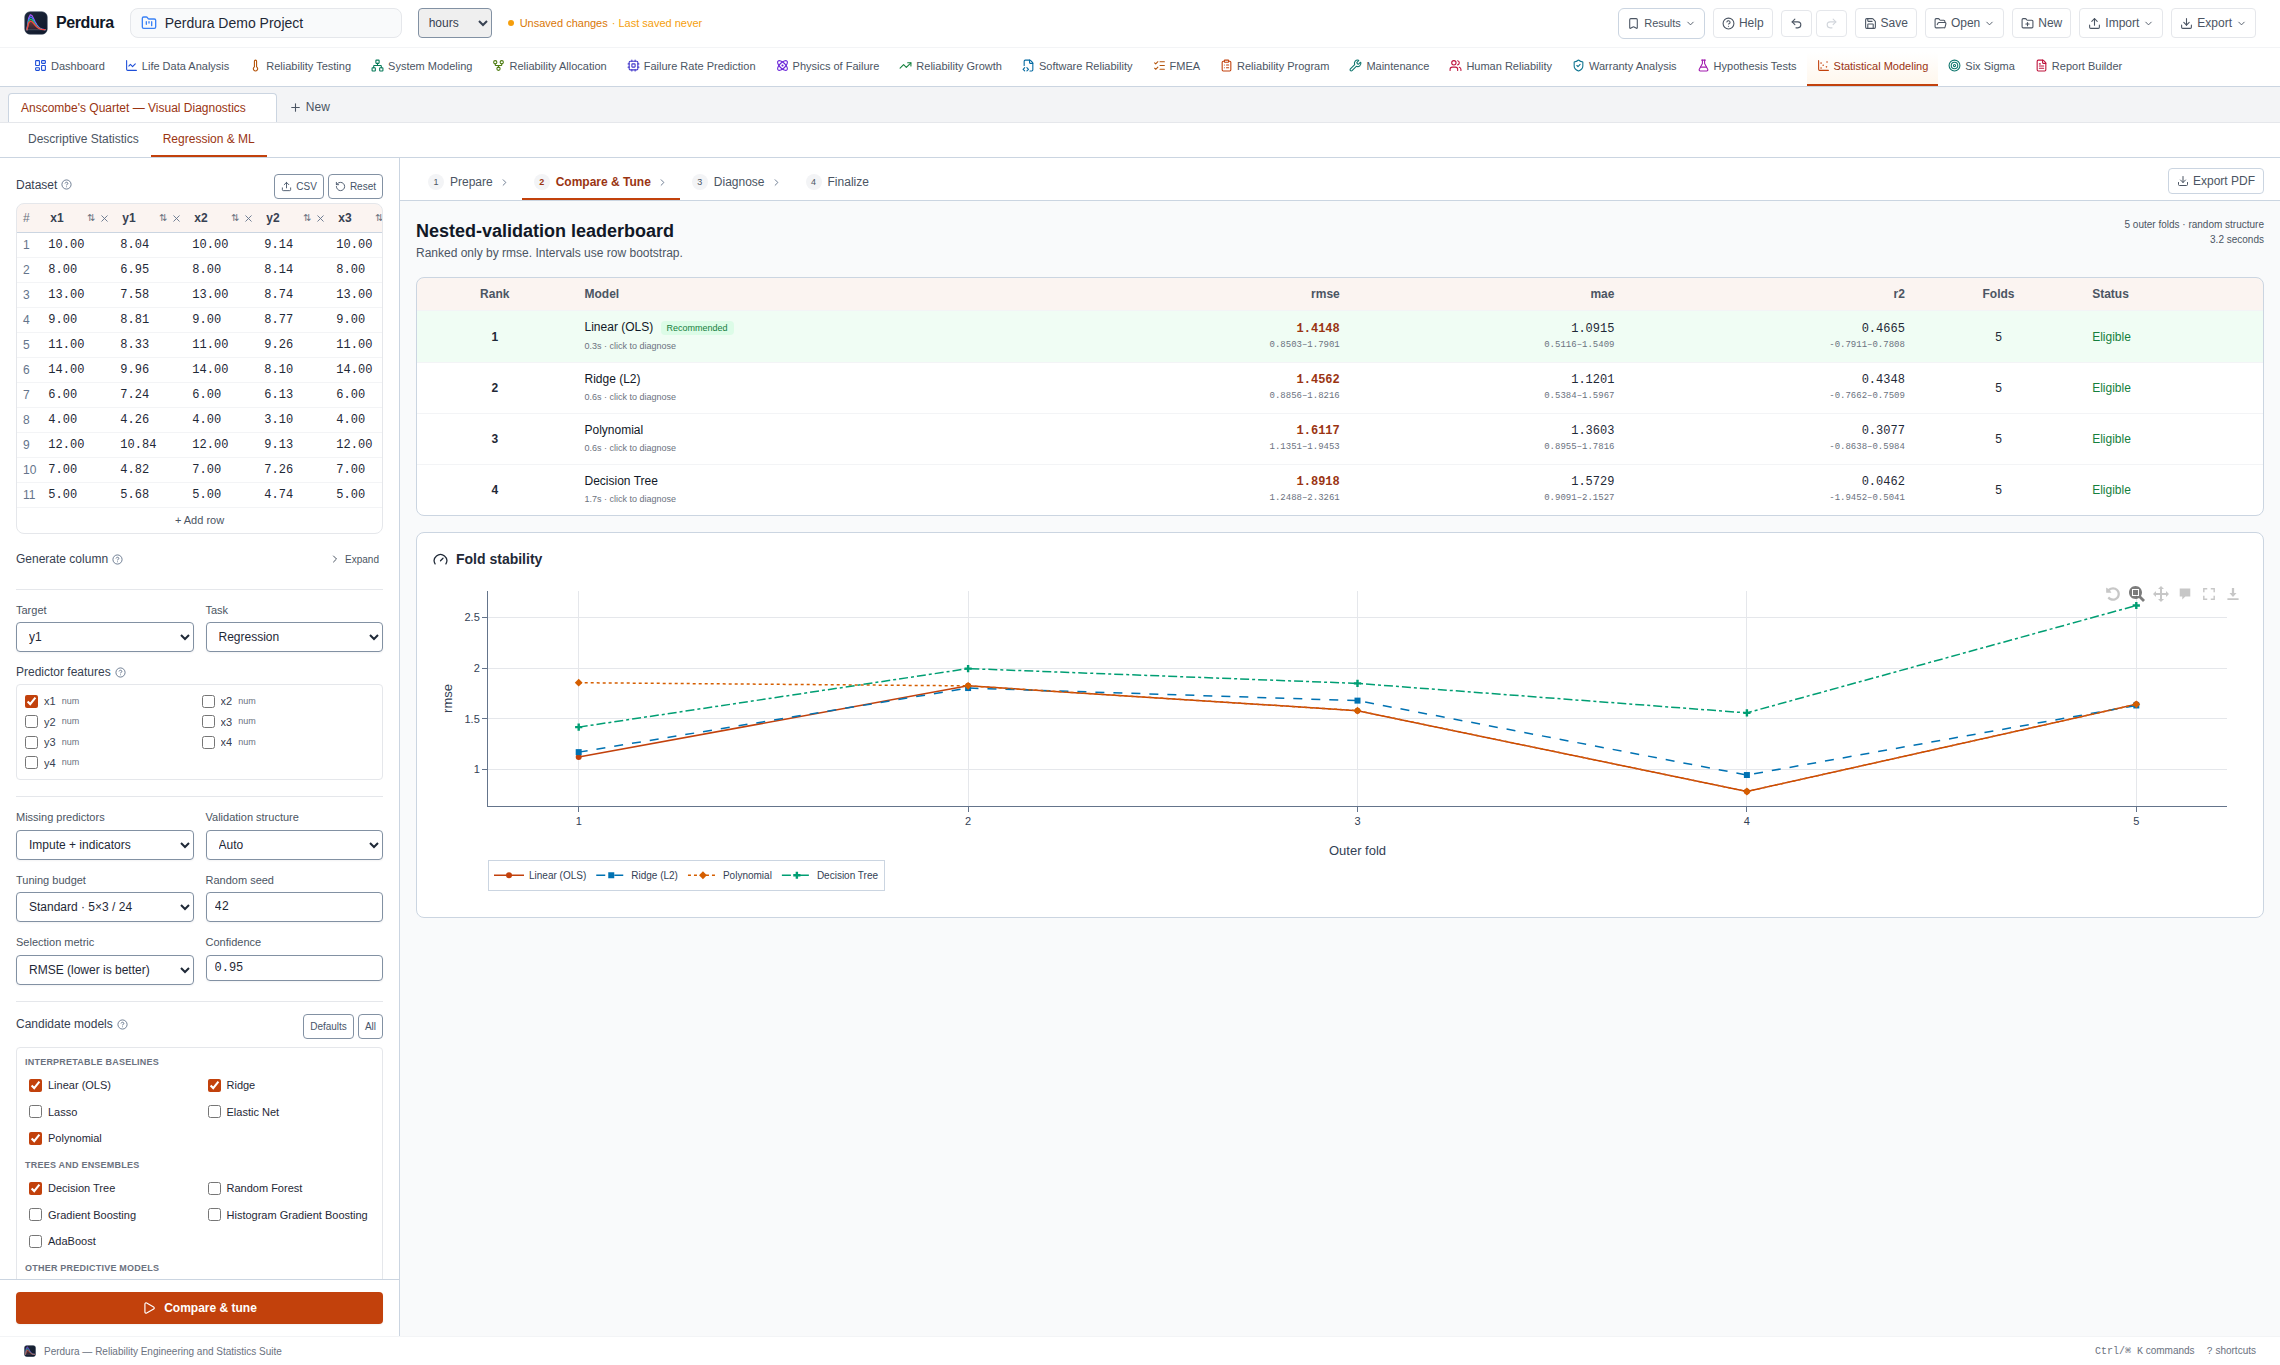
Use the arrows, arrow keys, or swipe to review each analysis. Open an image for full resolution.
Six Sigma Toolkit
Evaluate measurement systems, process stability and capability, DOE effects and predictive performance.
- Process-capability studies: Cp, Cpk, Pp and Ppk with ISO 22514-4 non-normal percentiles and Box–Cox guidance
- Measurement-system analysis (MSA) with Gage R&R
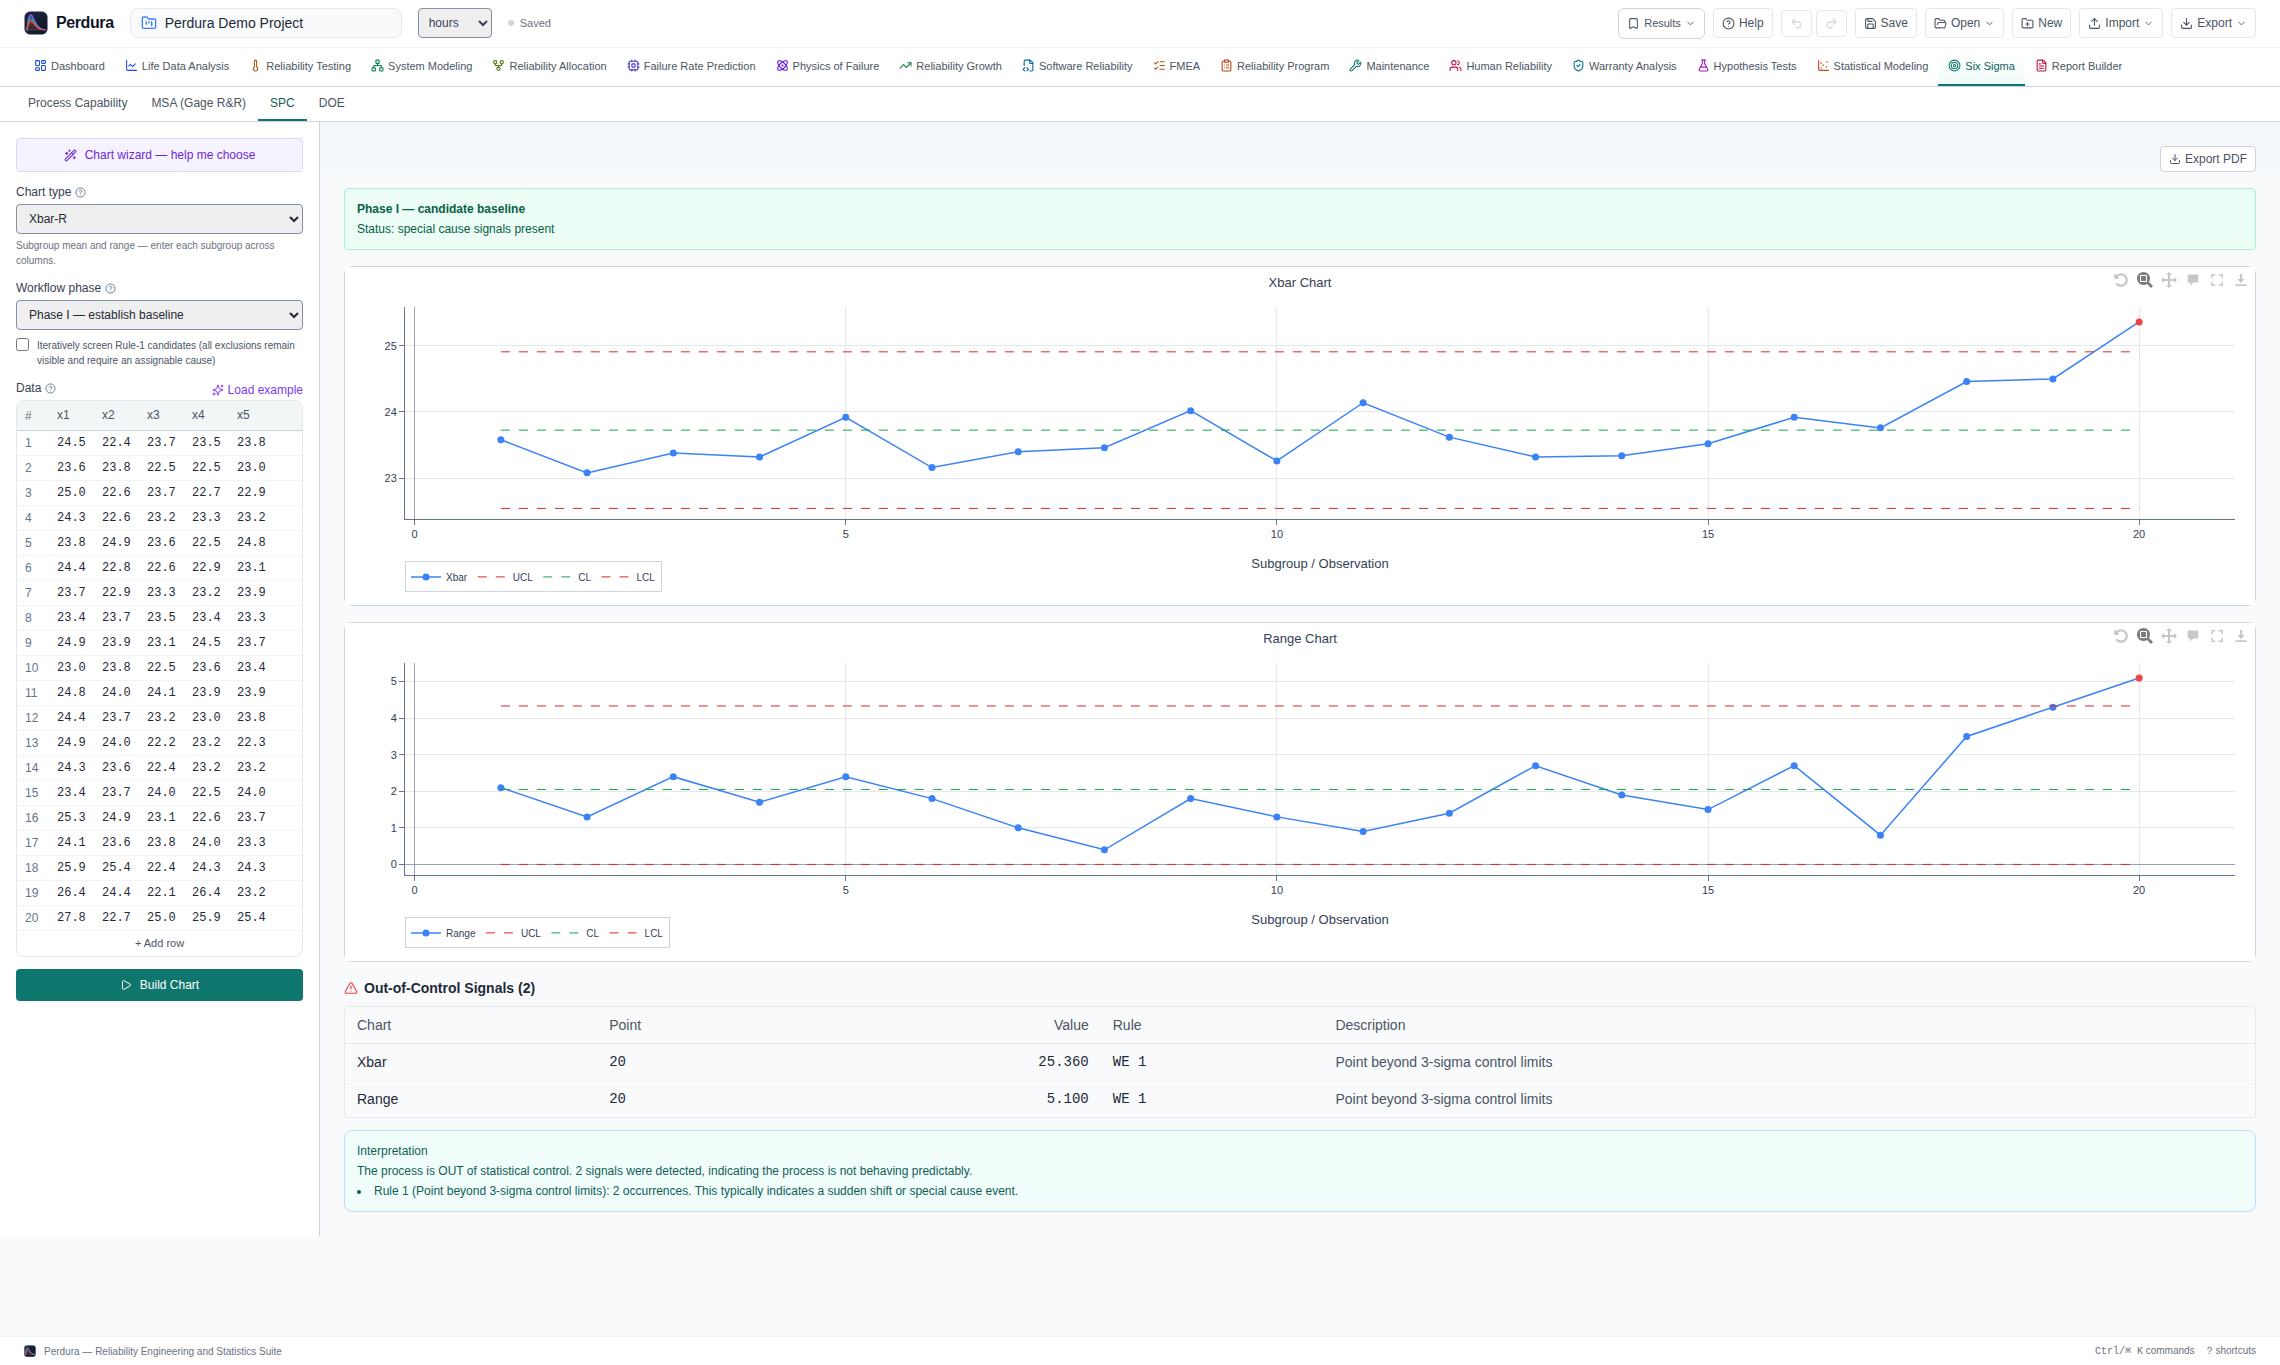
- SPC control charts: I–MR, Xbar–R/S, p, np, c and u with Western Electric out-of-control rules
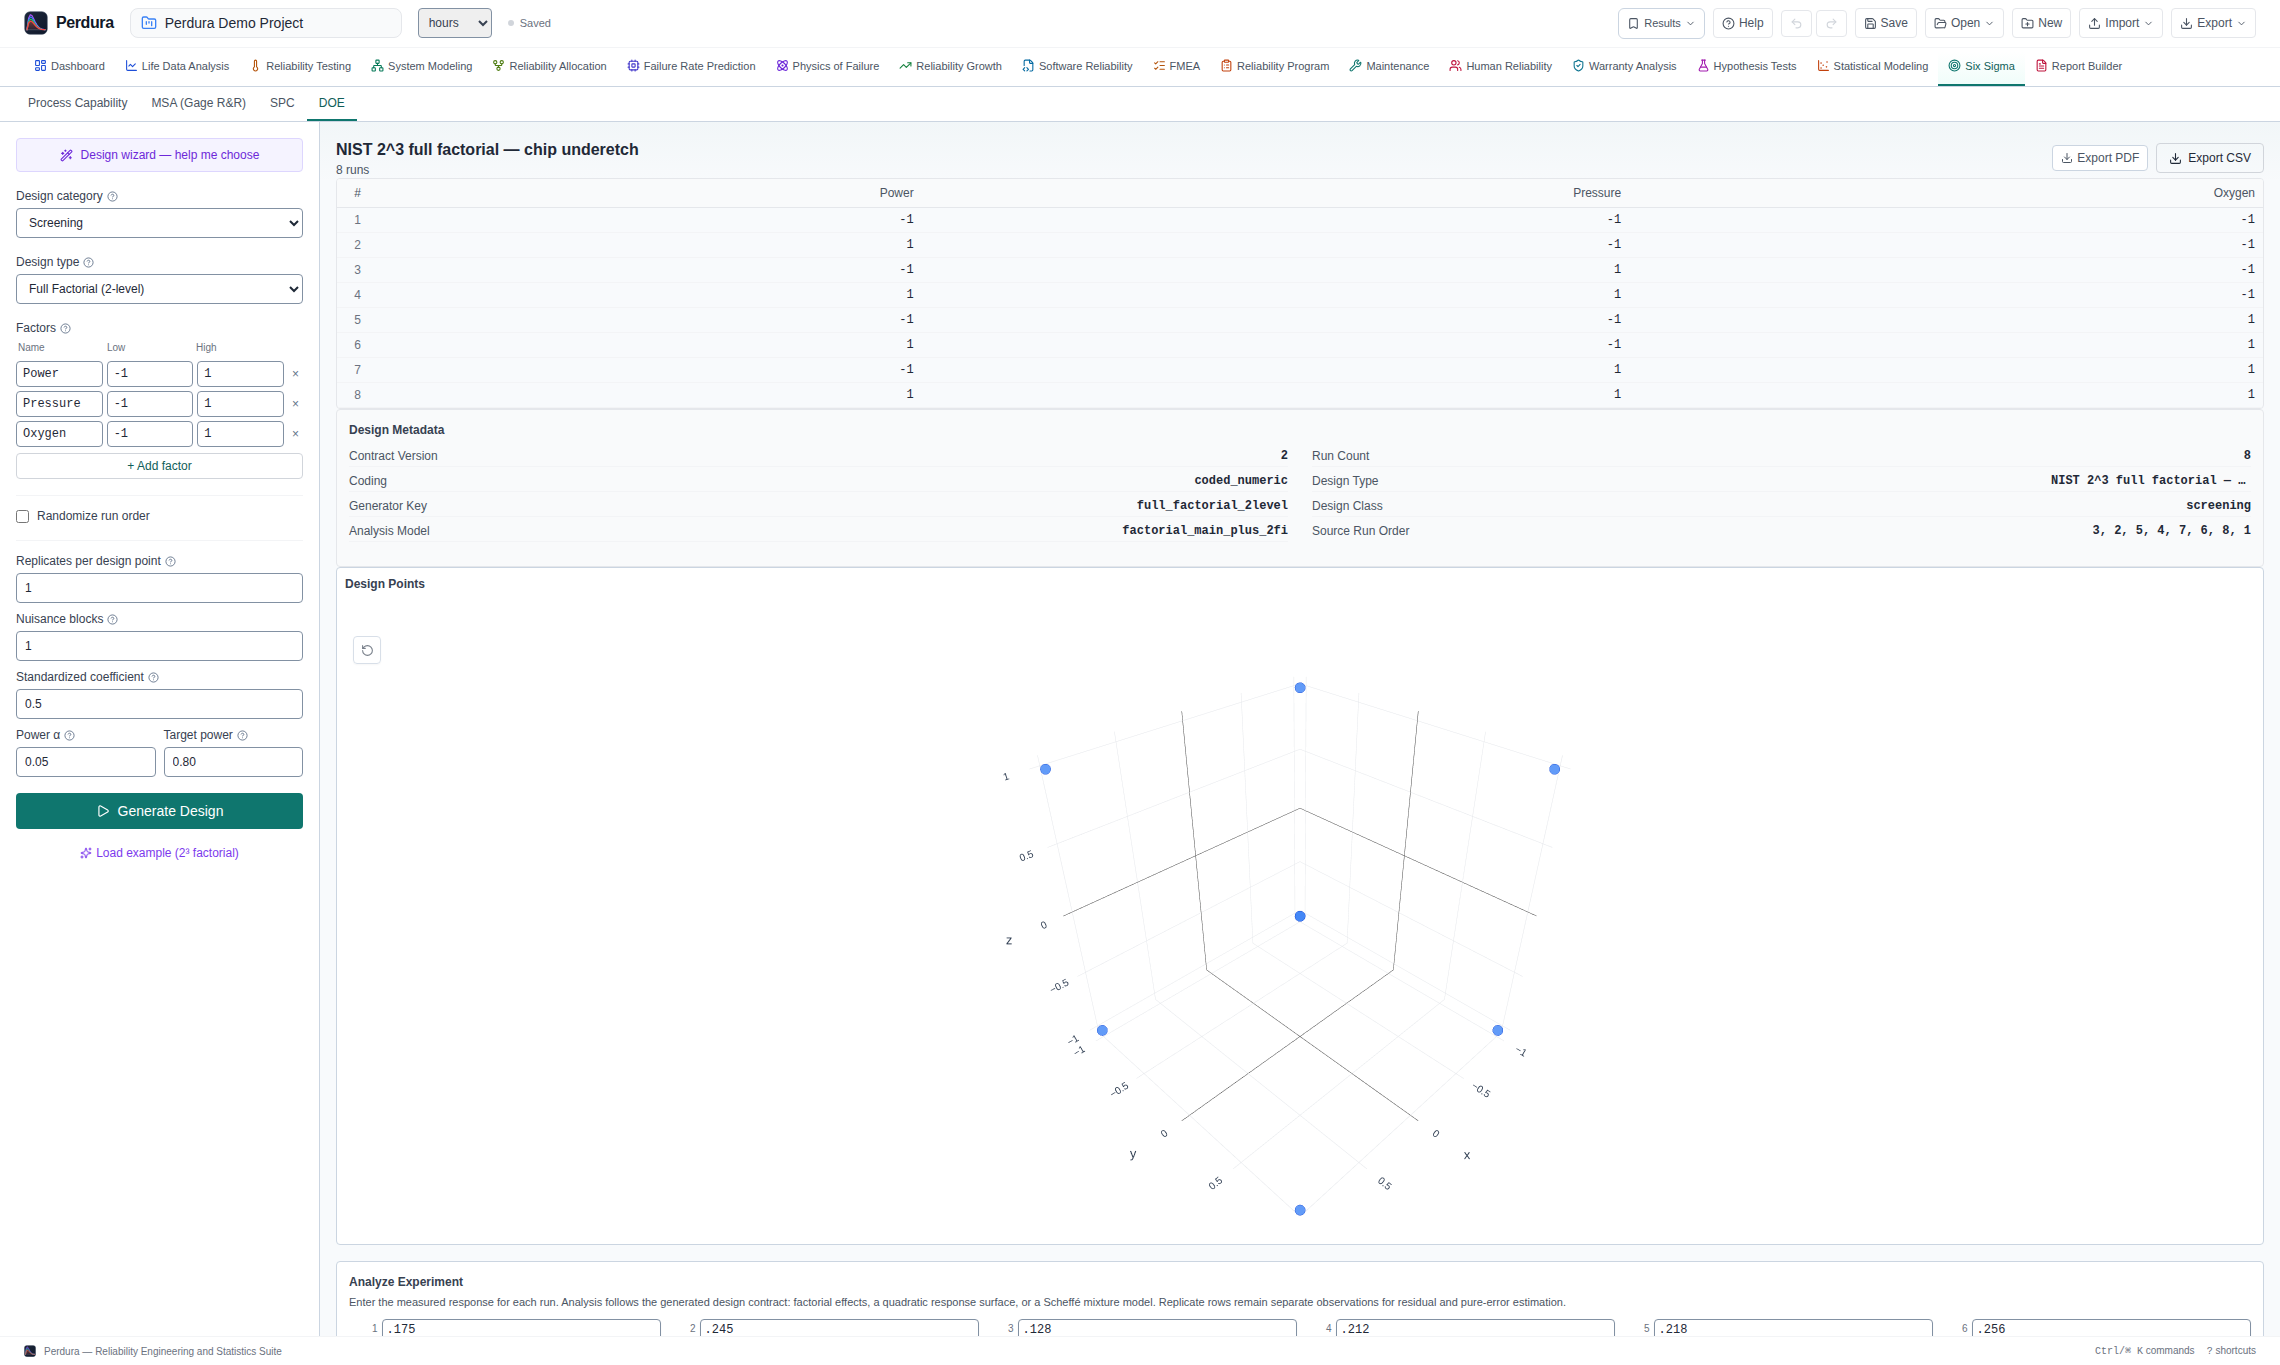
- Design of experiments (DOE): effects, percent contribution, Lenth’s margin, Pareto, half-normal and interaction plots
- Predictive analytics: decision tree, random forest, gradient boosting, SVM, KNN, AdaBoost, neural net and CHAID
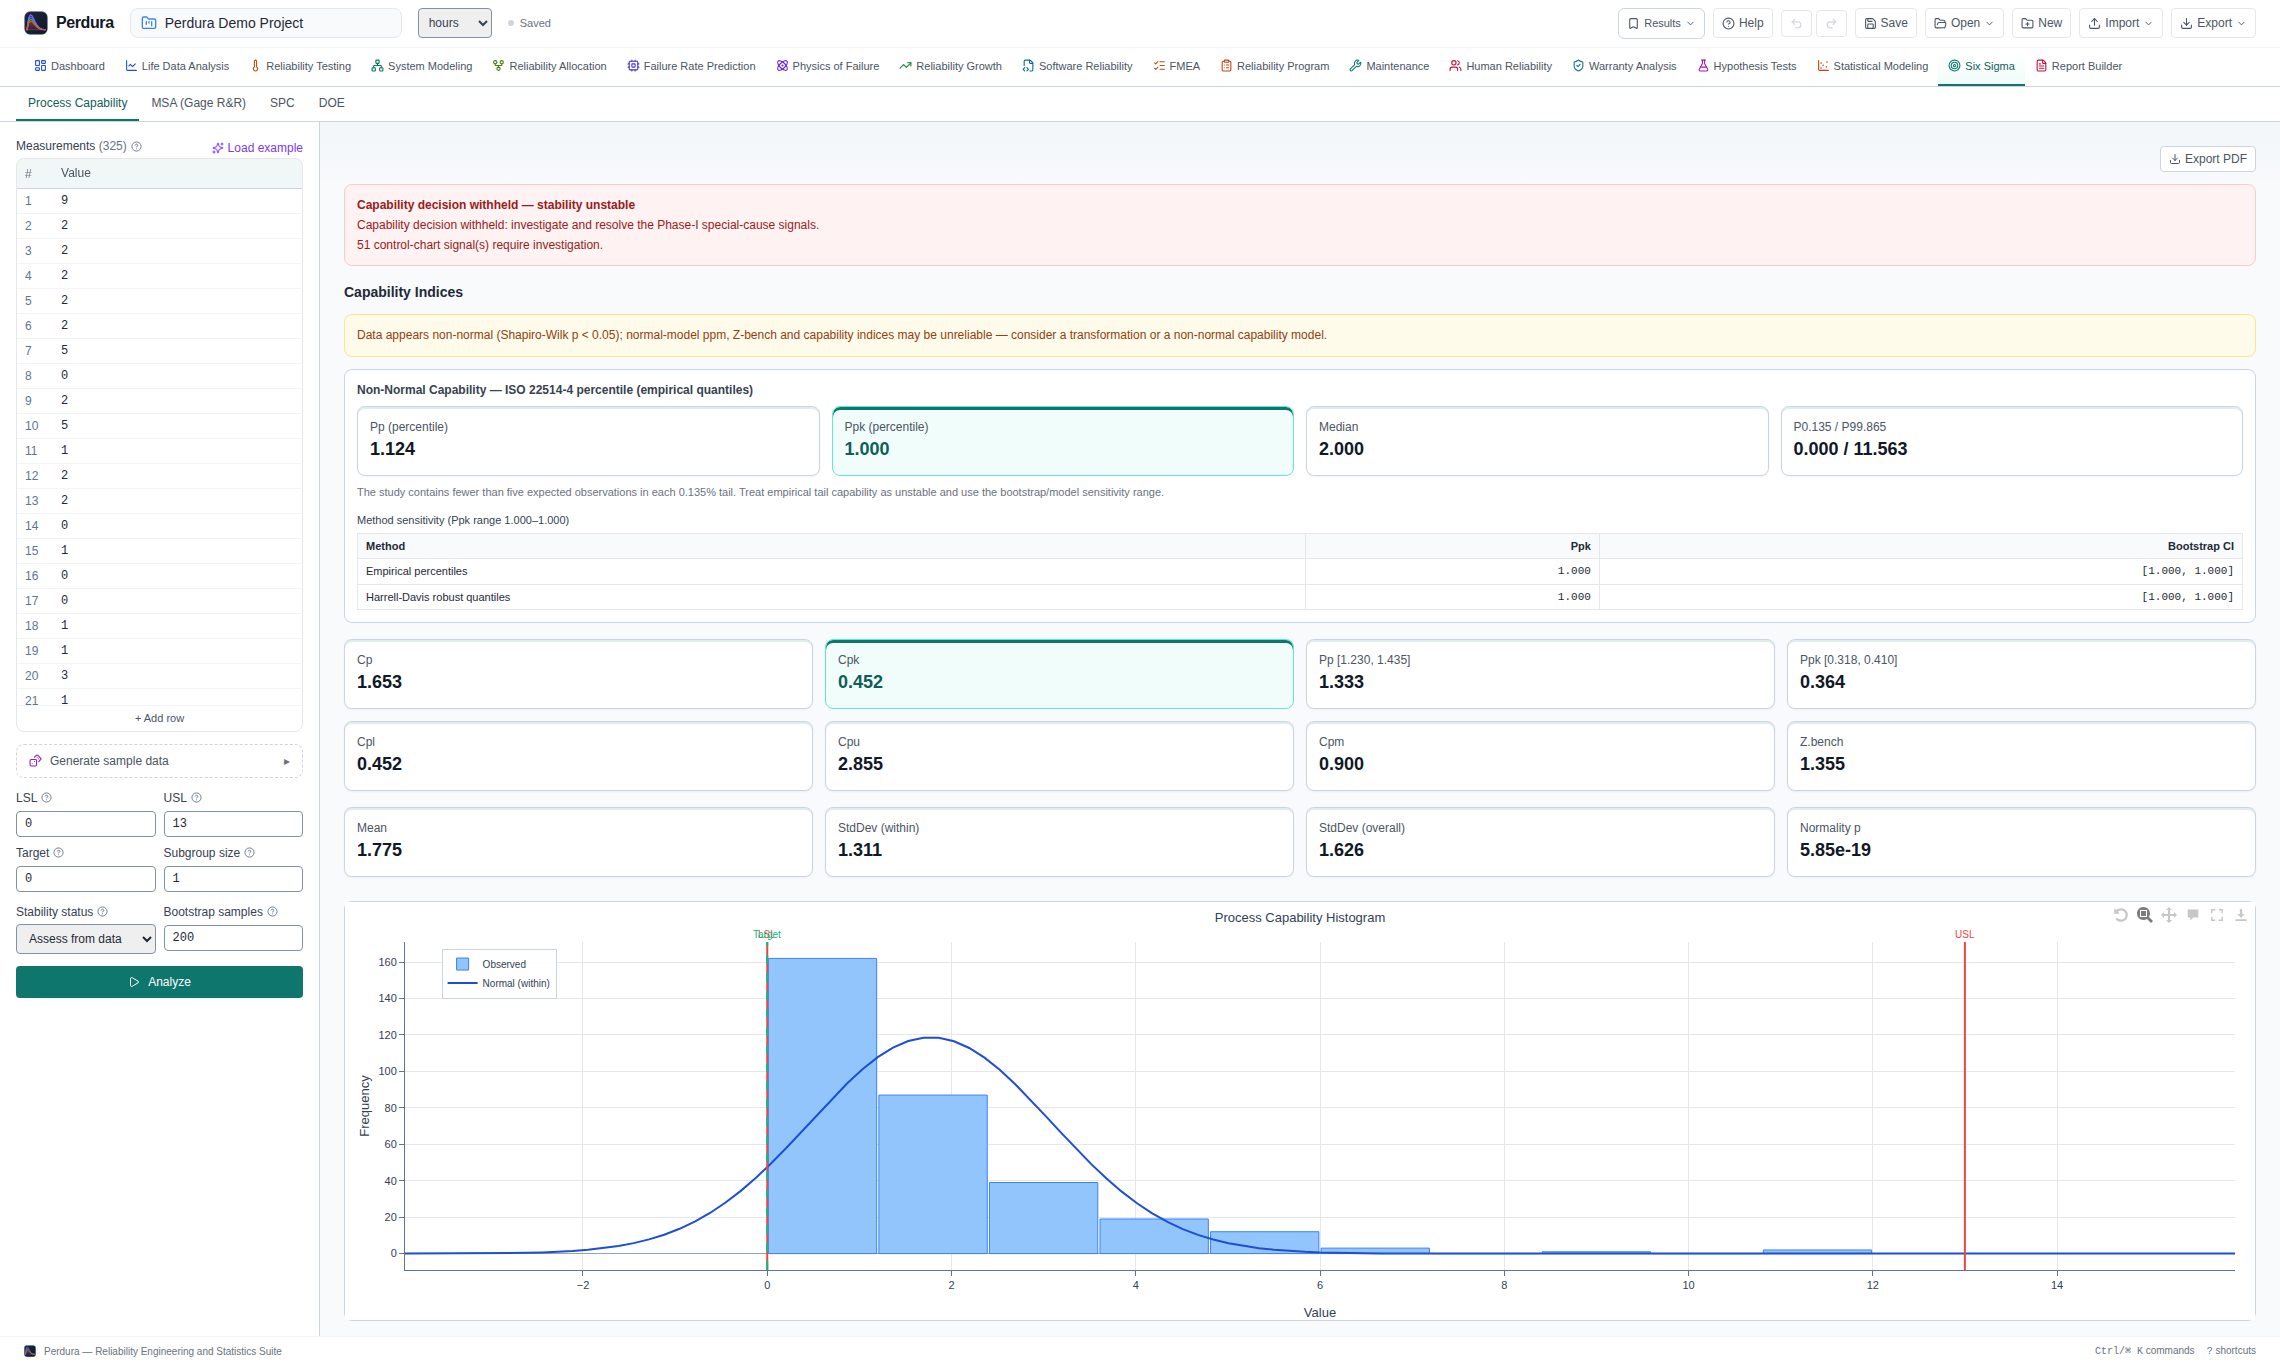
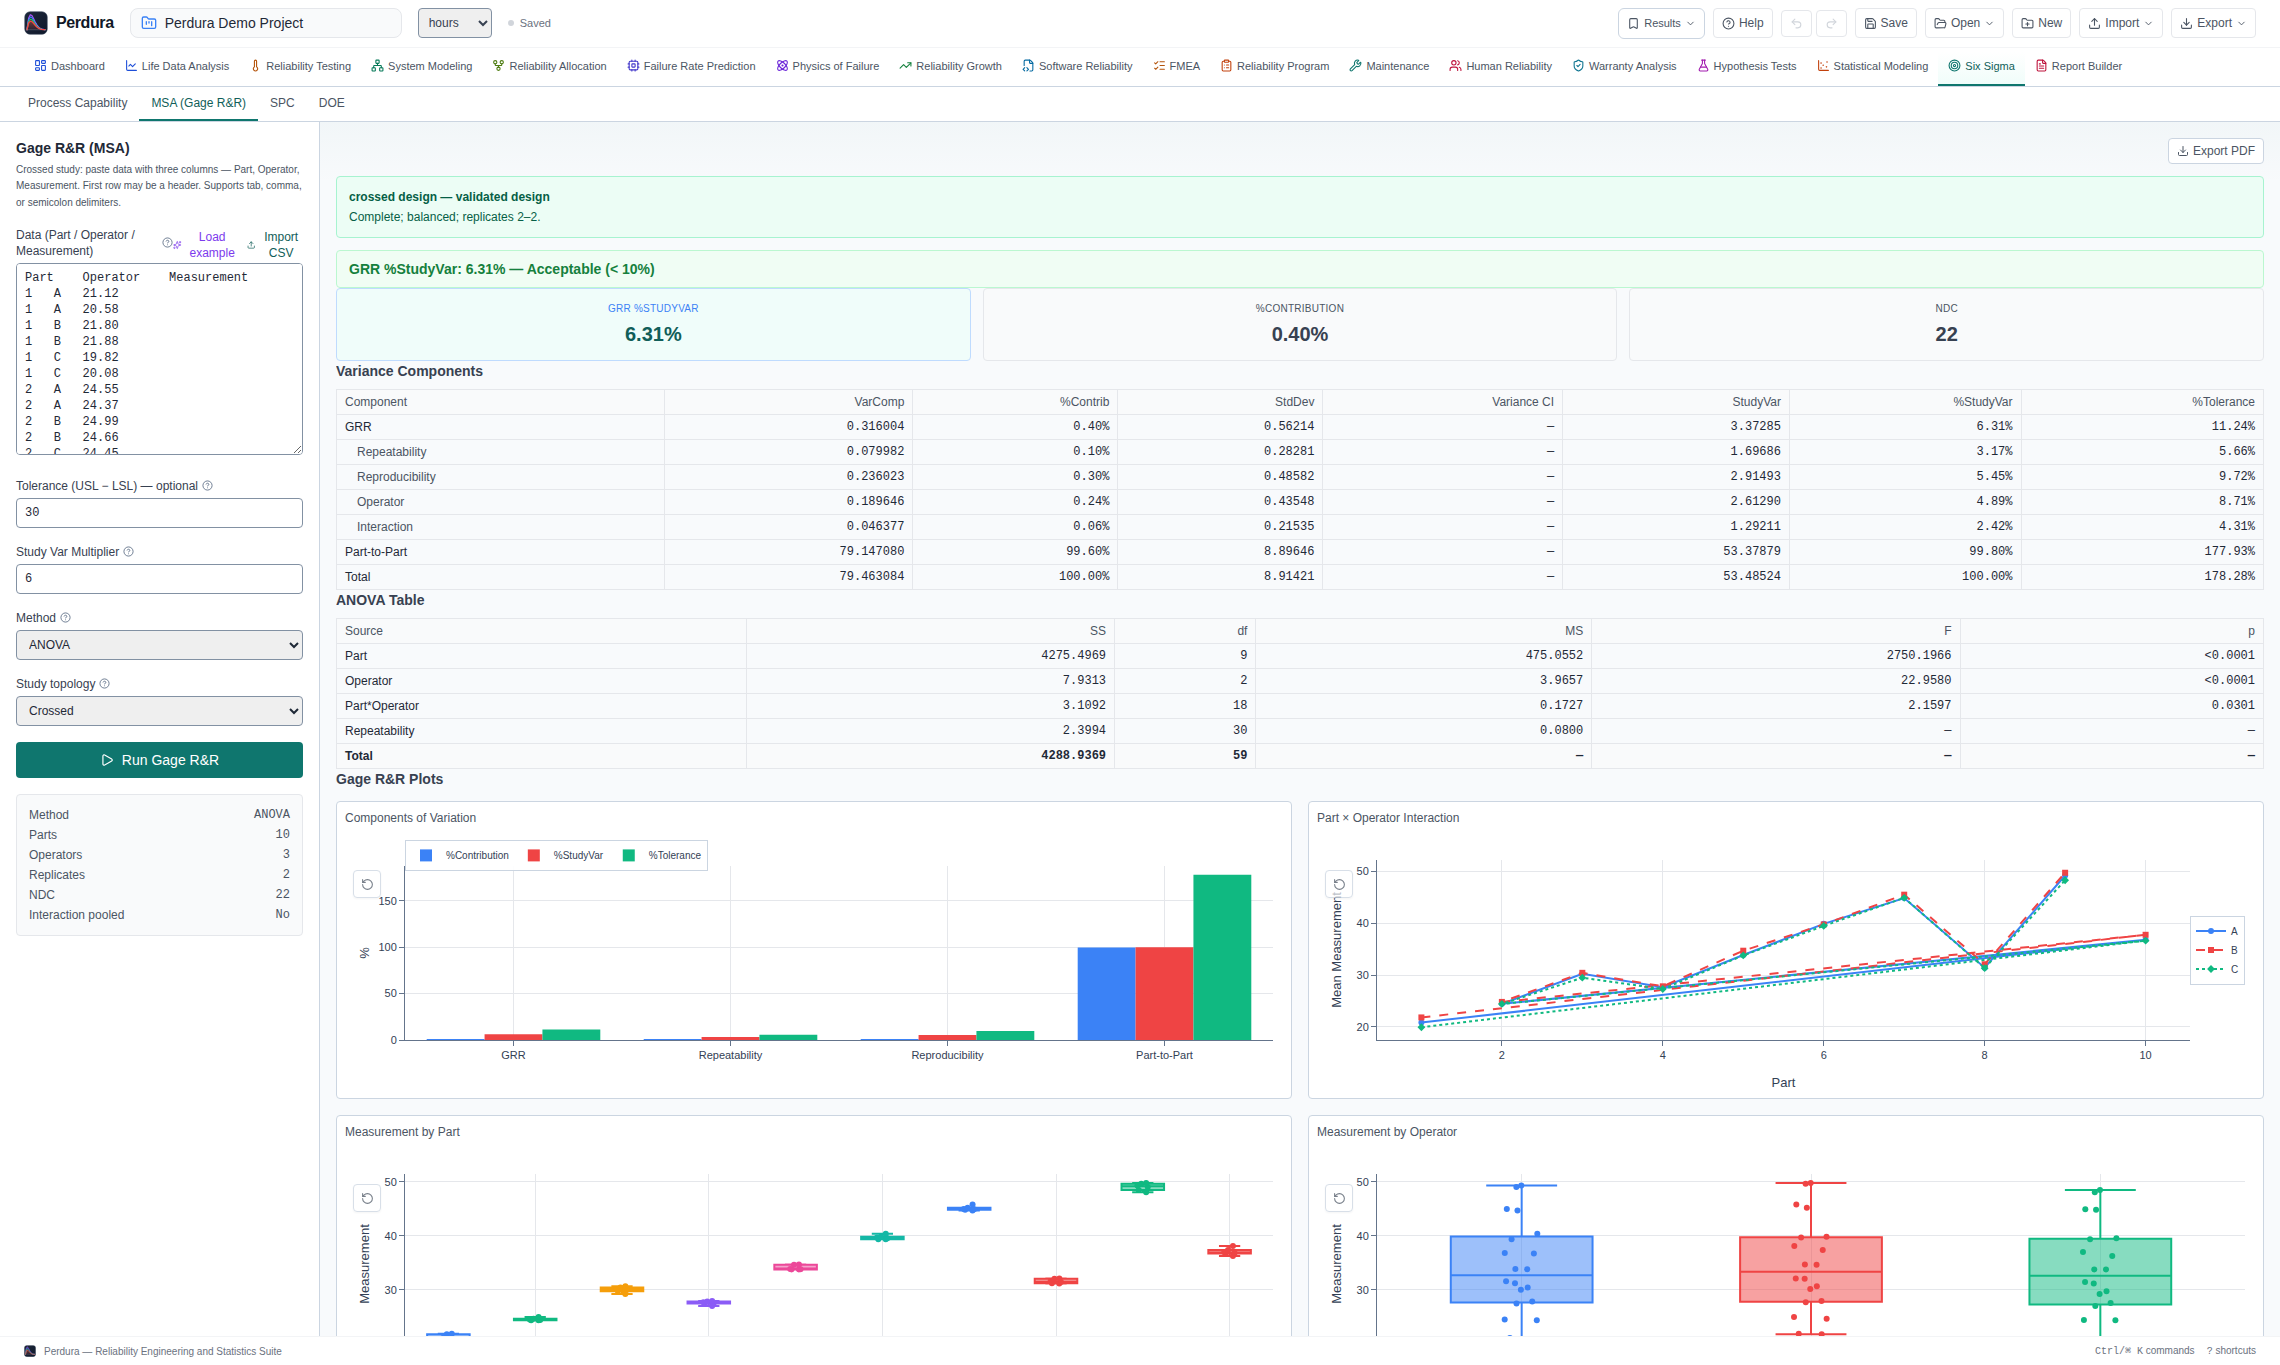
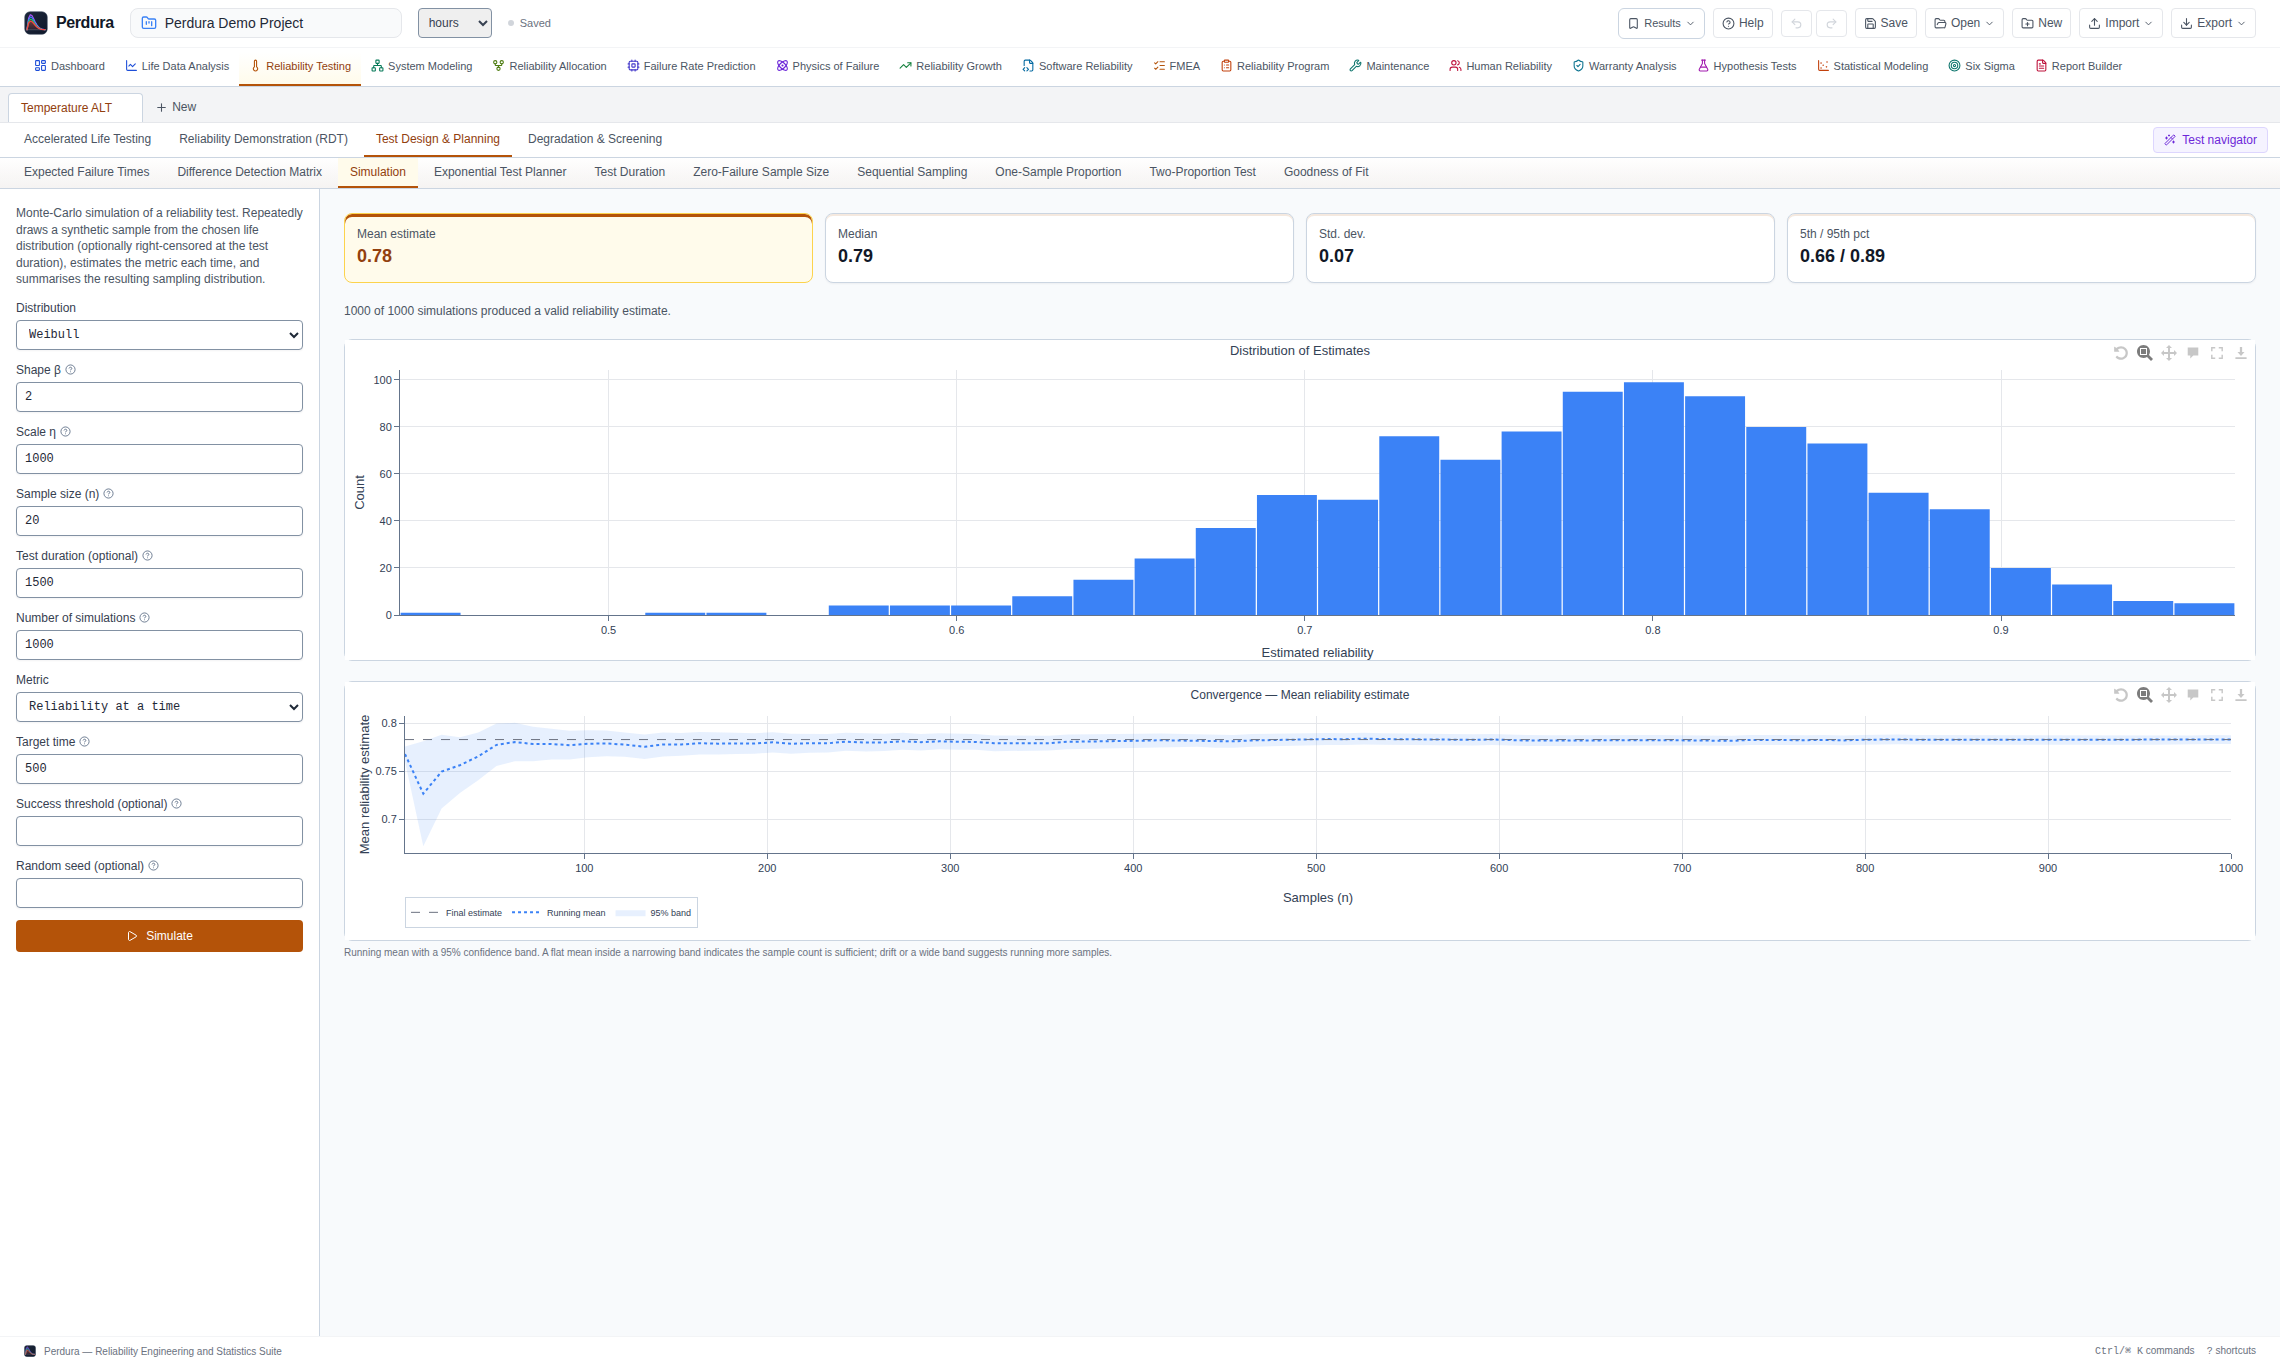
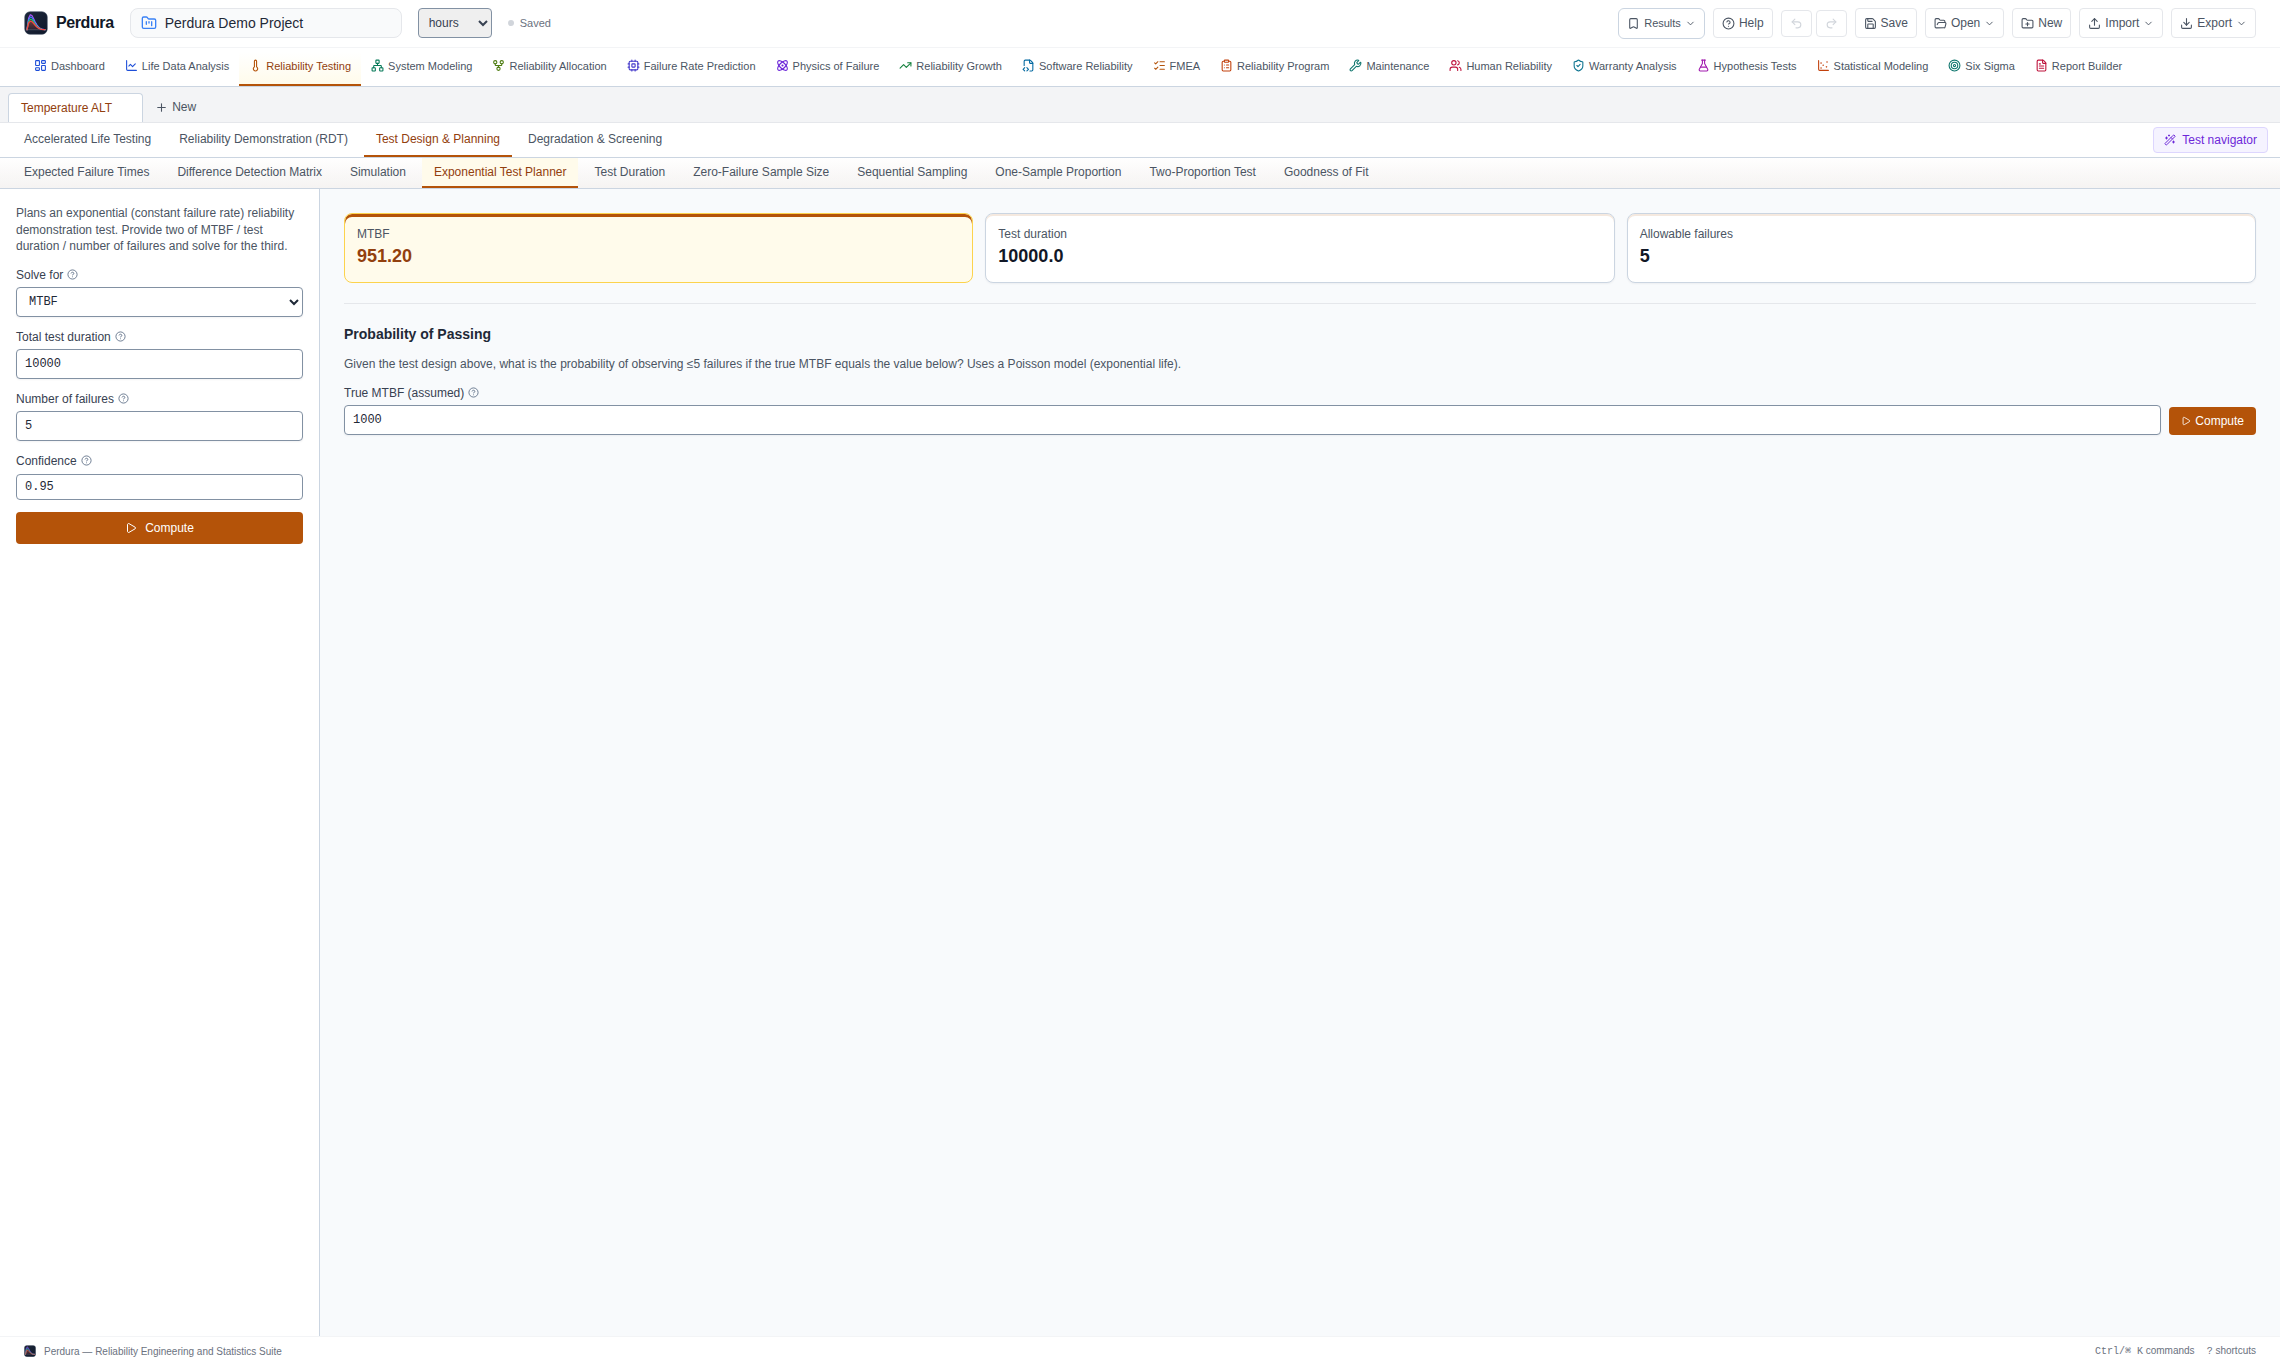
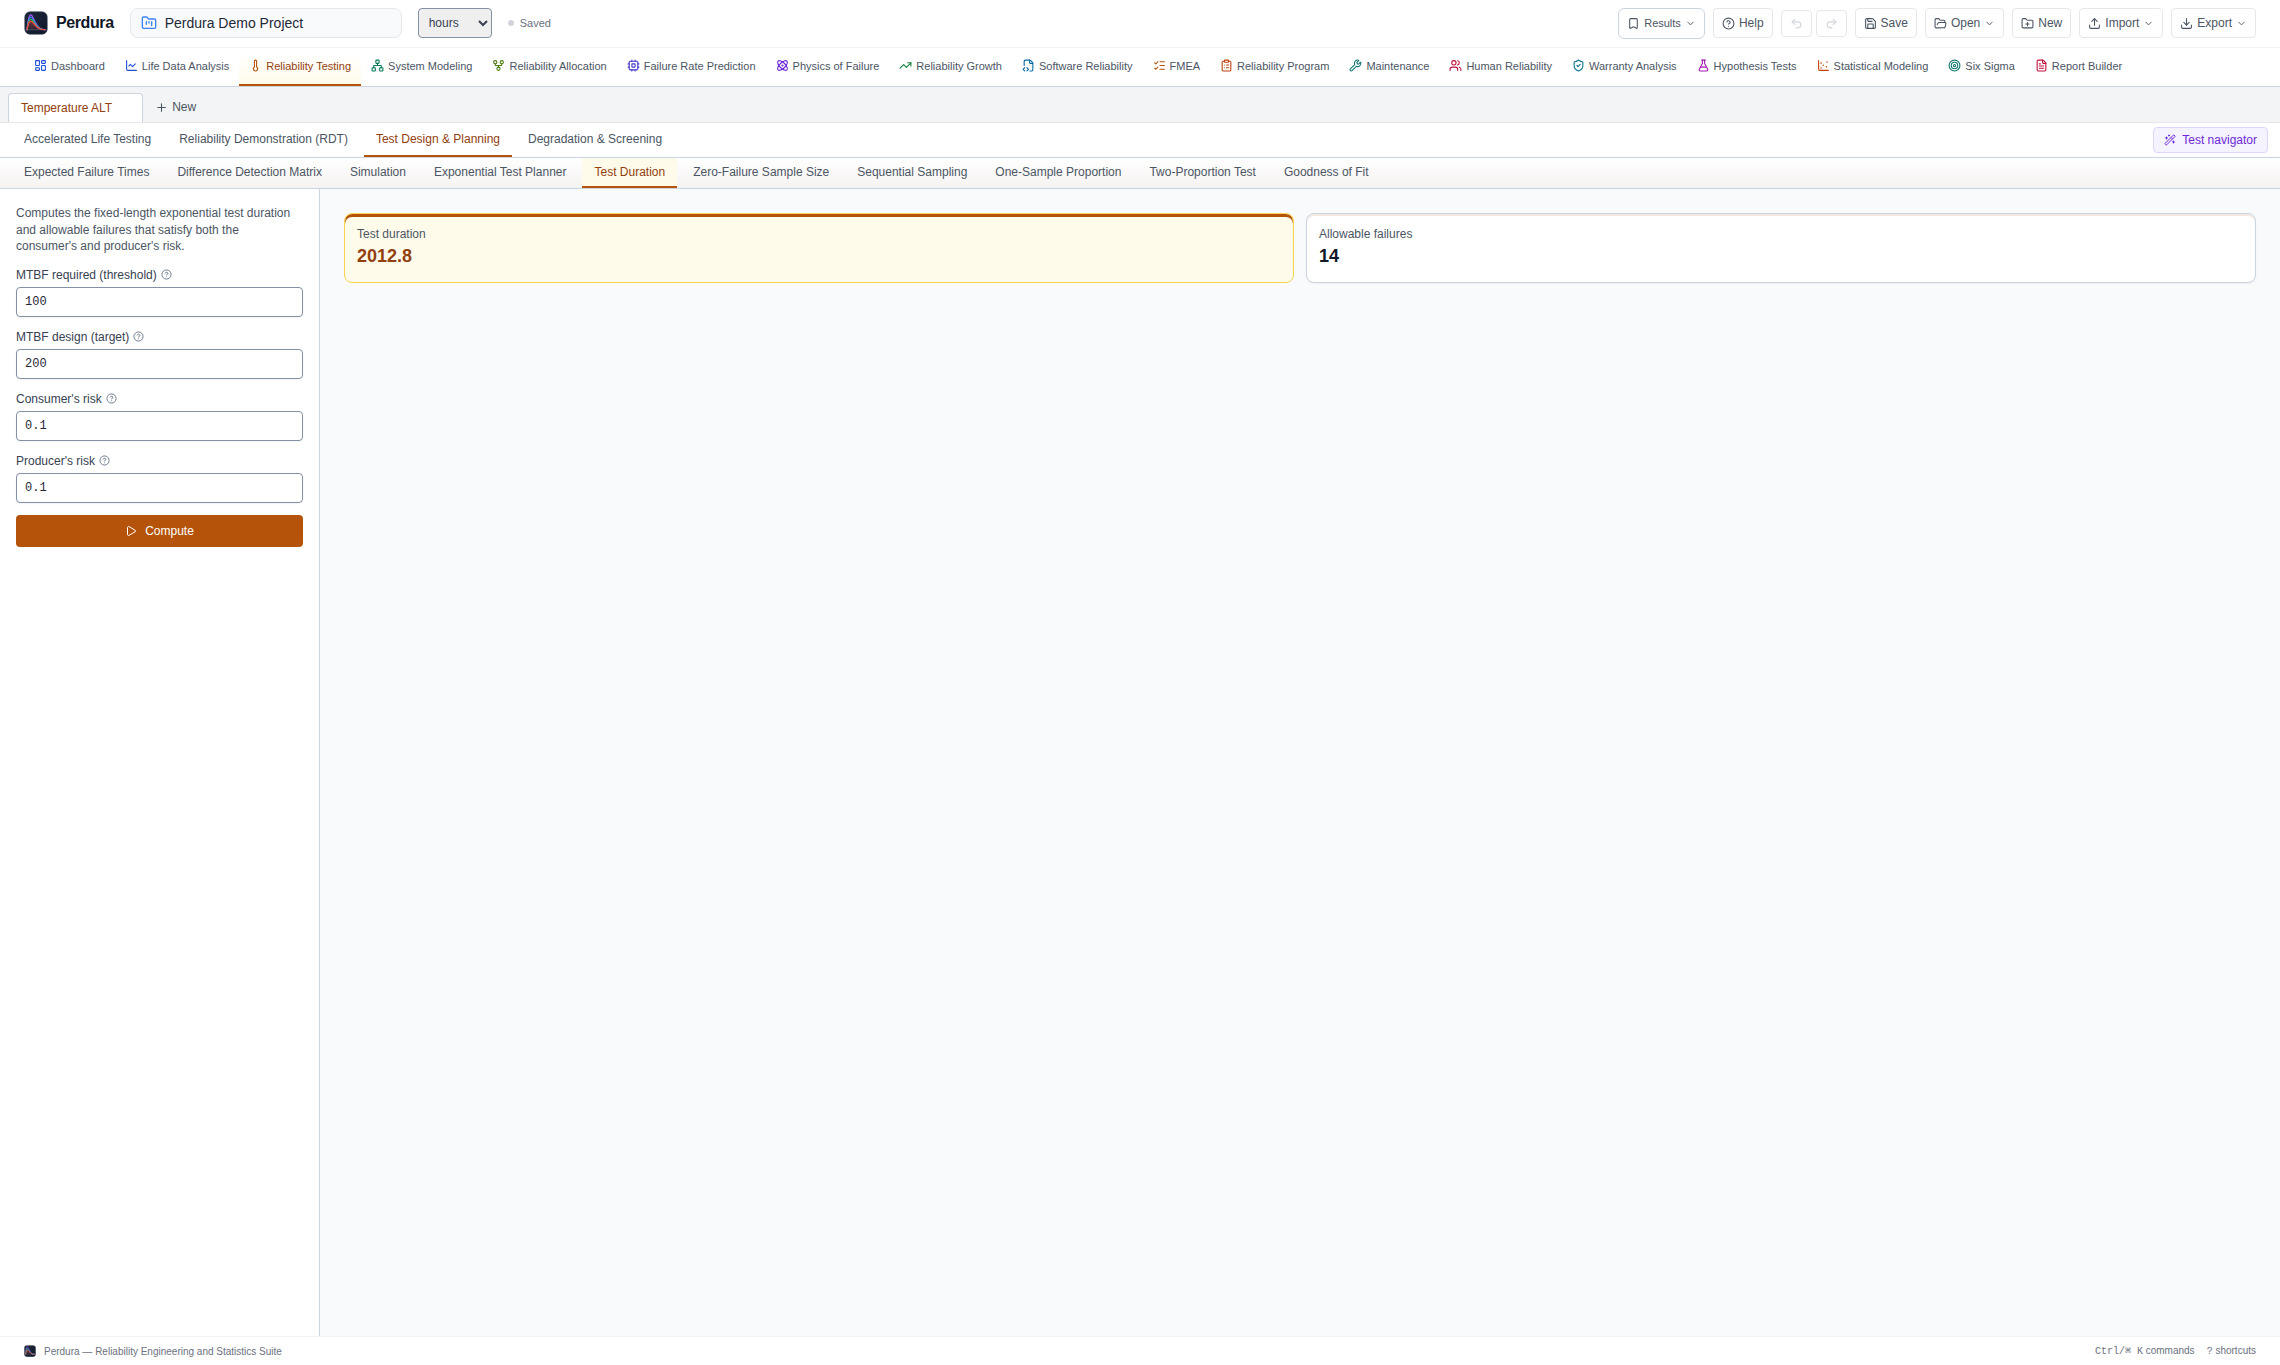
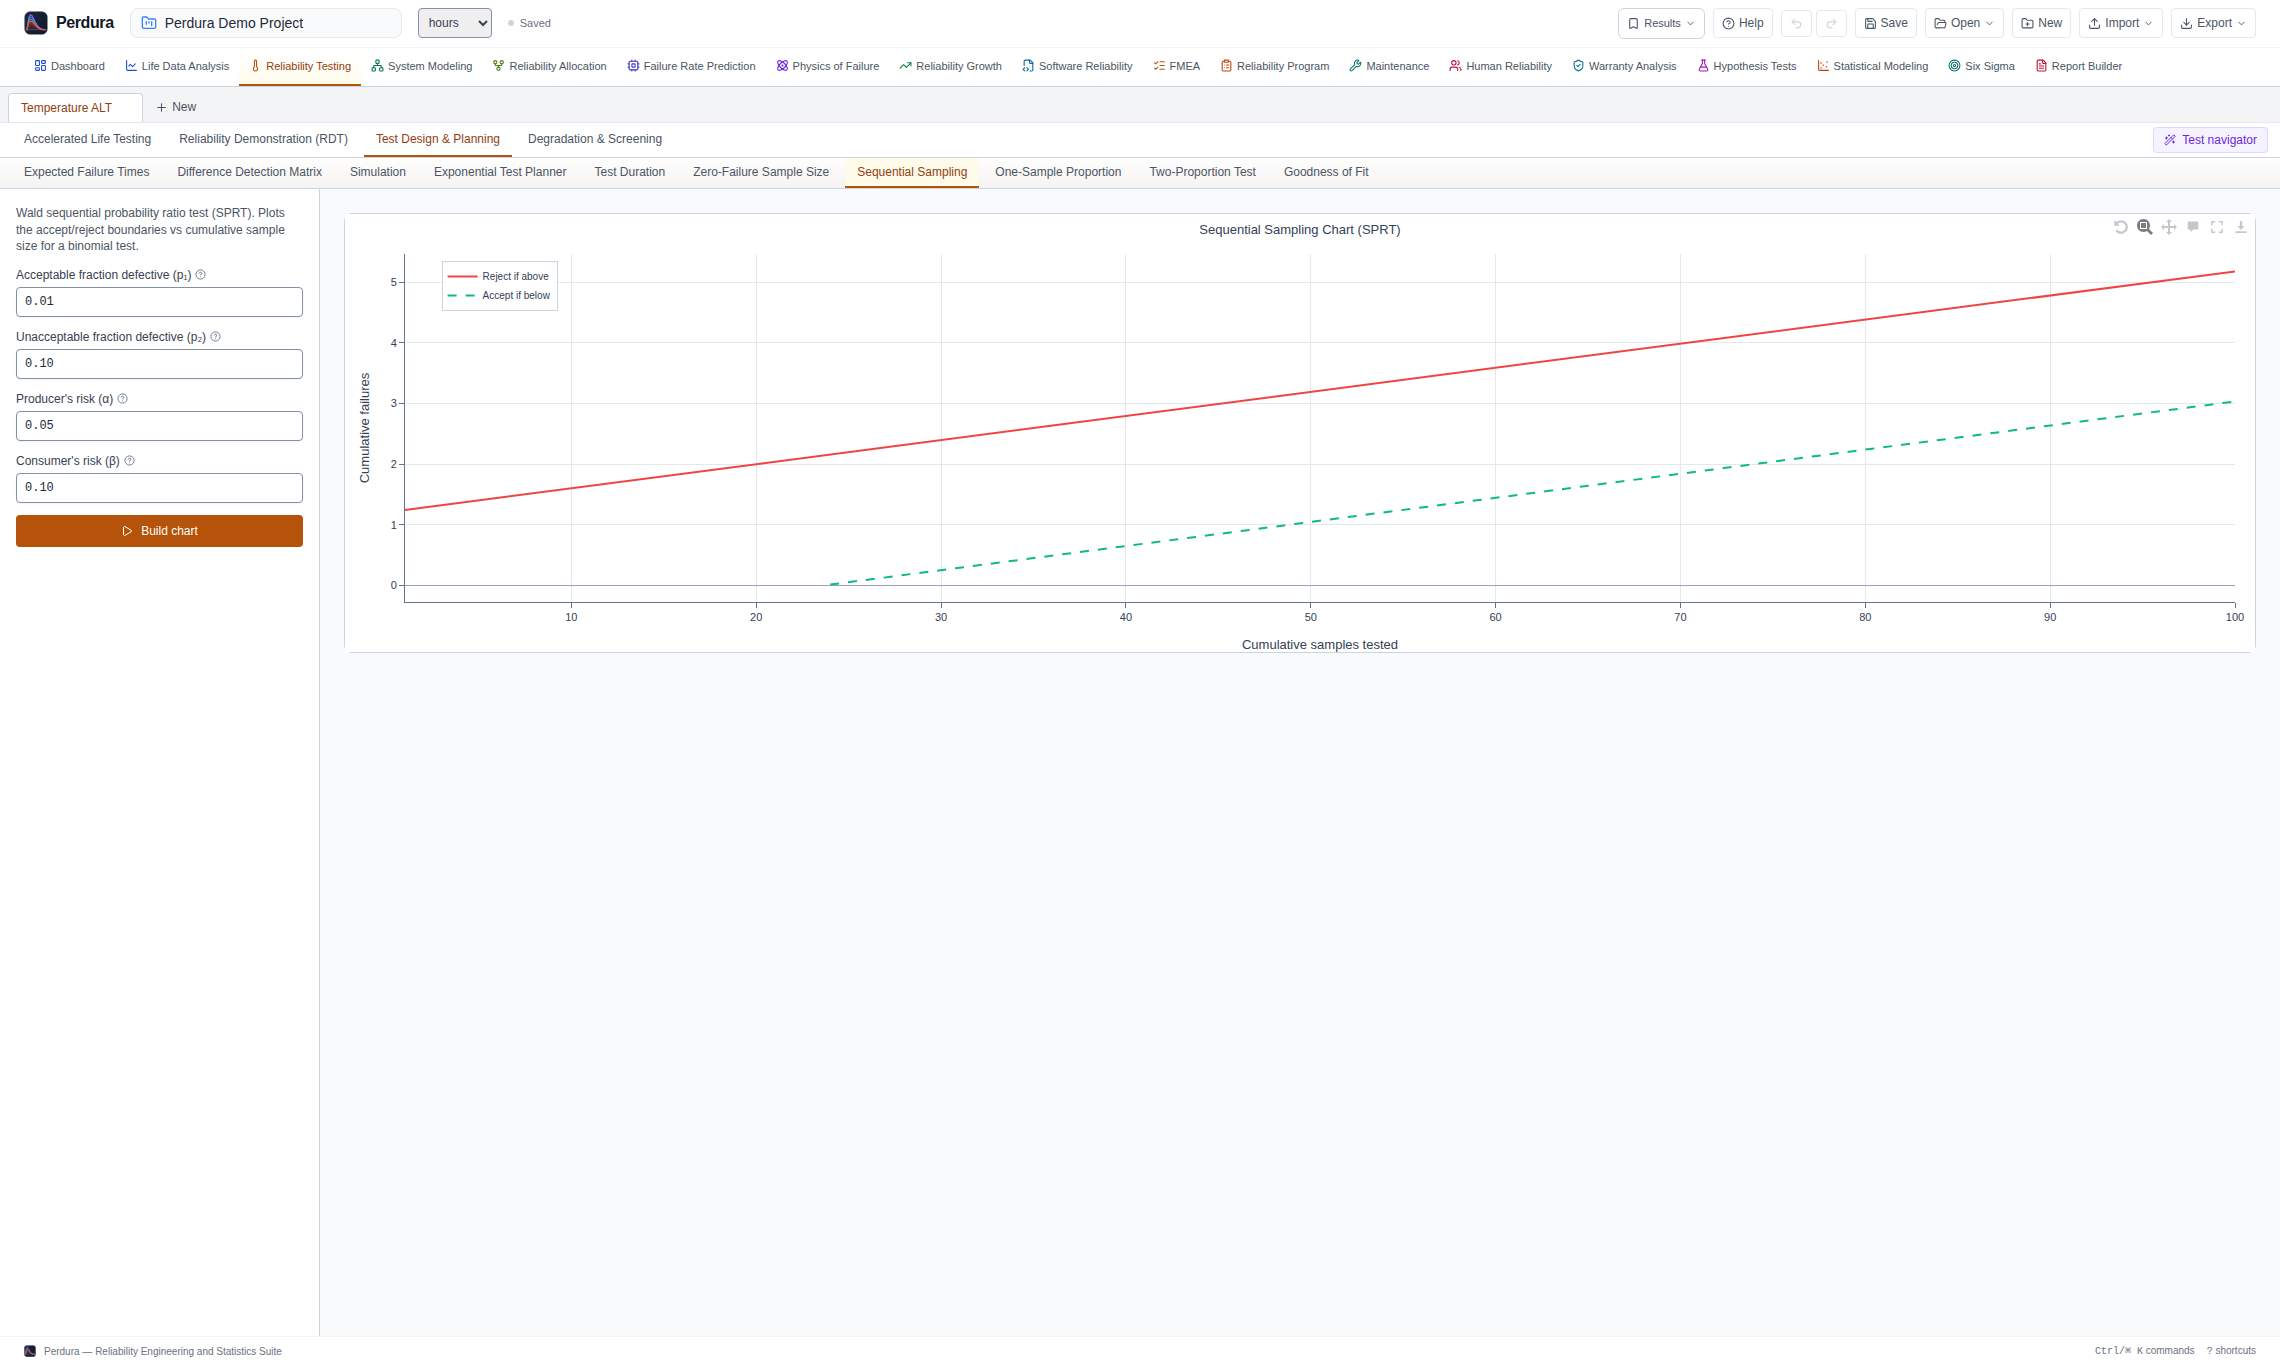
Reliability Test Planning & Demonstration
Size and evaluate qualification and demonstration tests using fixed, sequential and simulation-based plans.
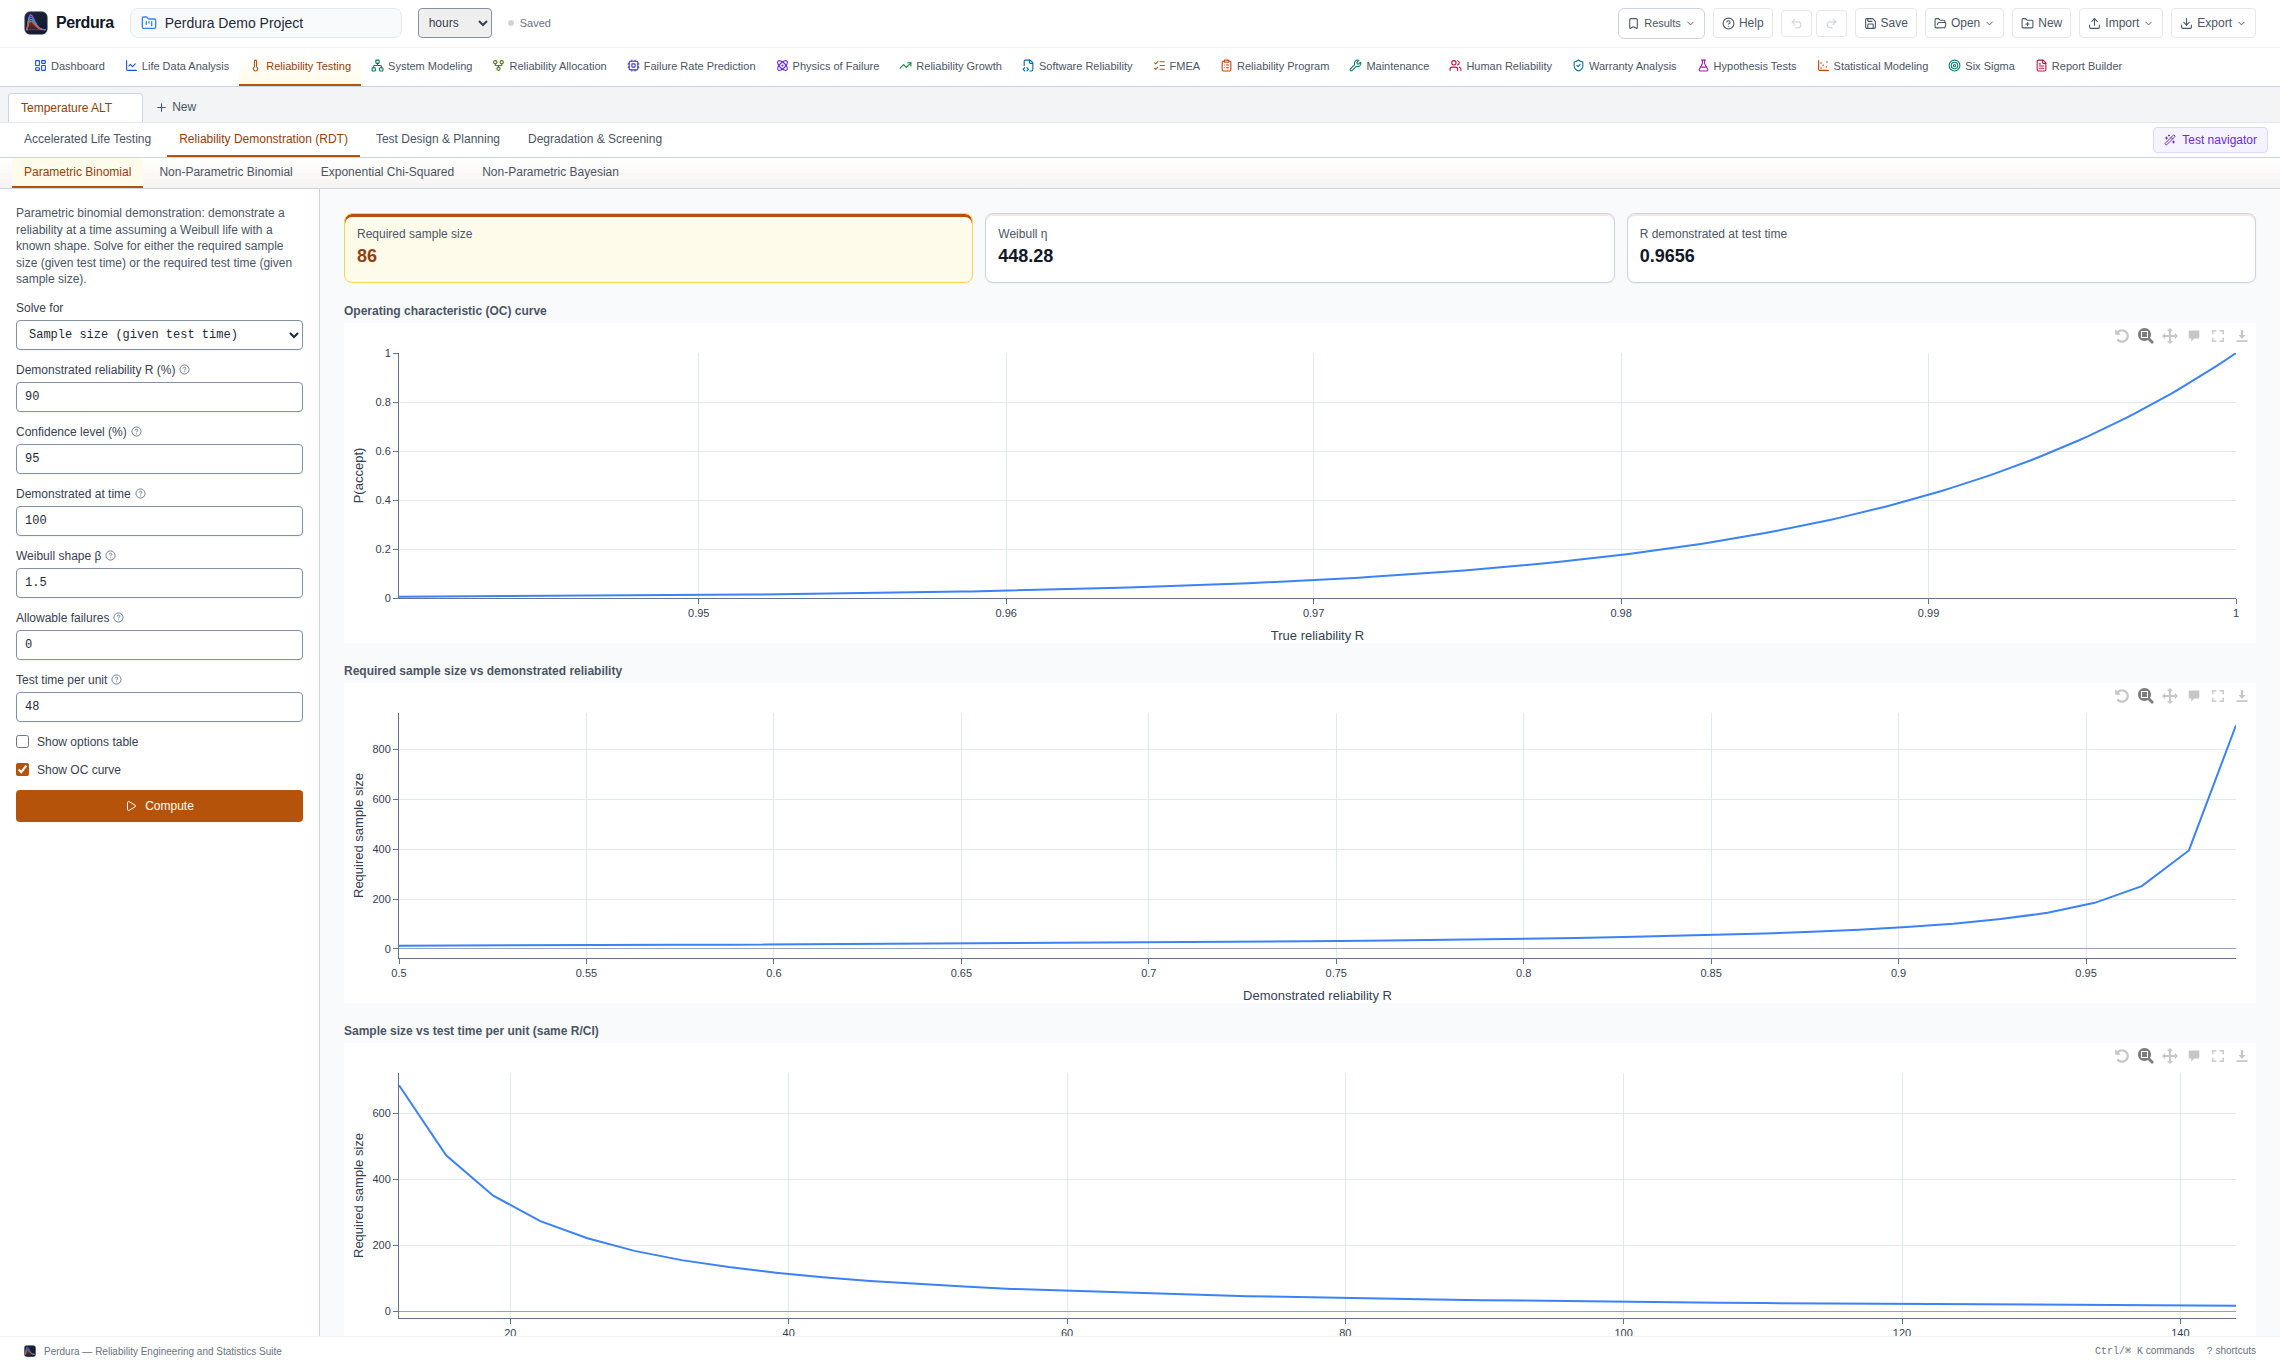
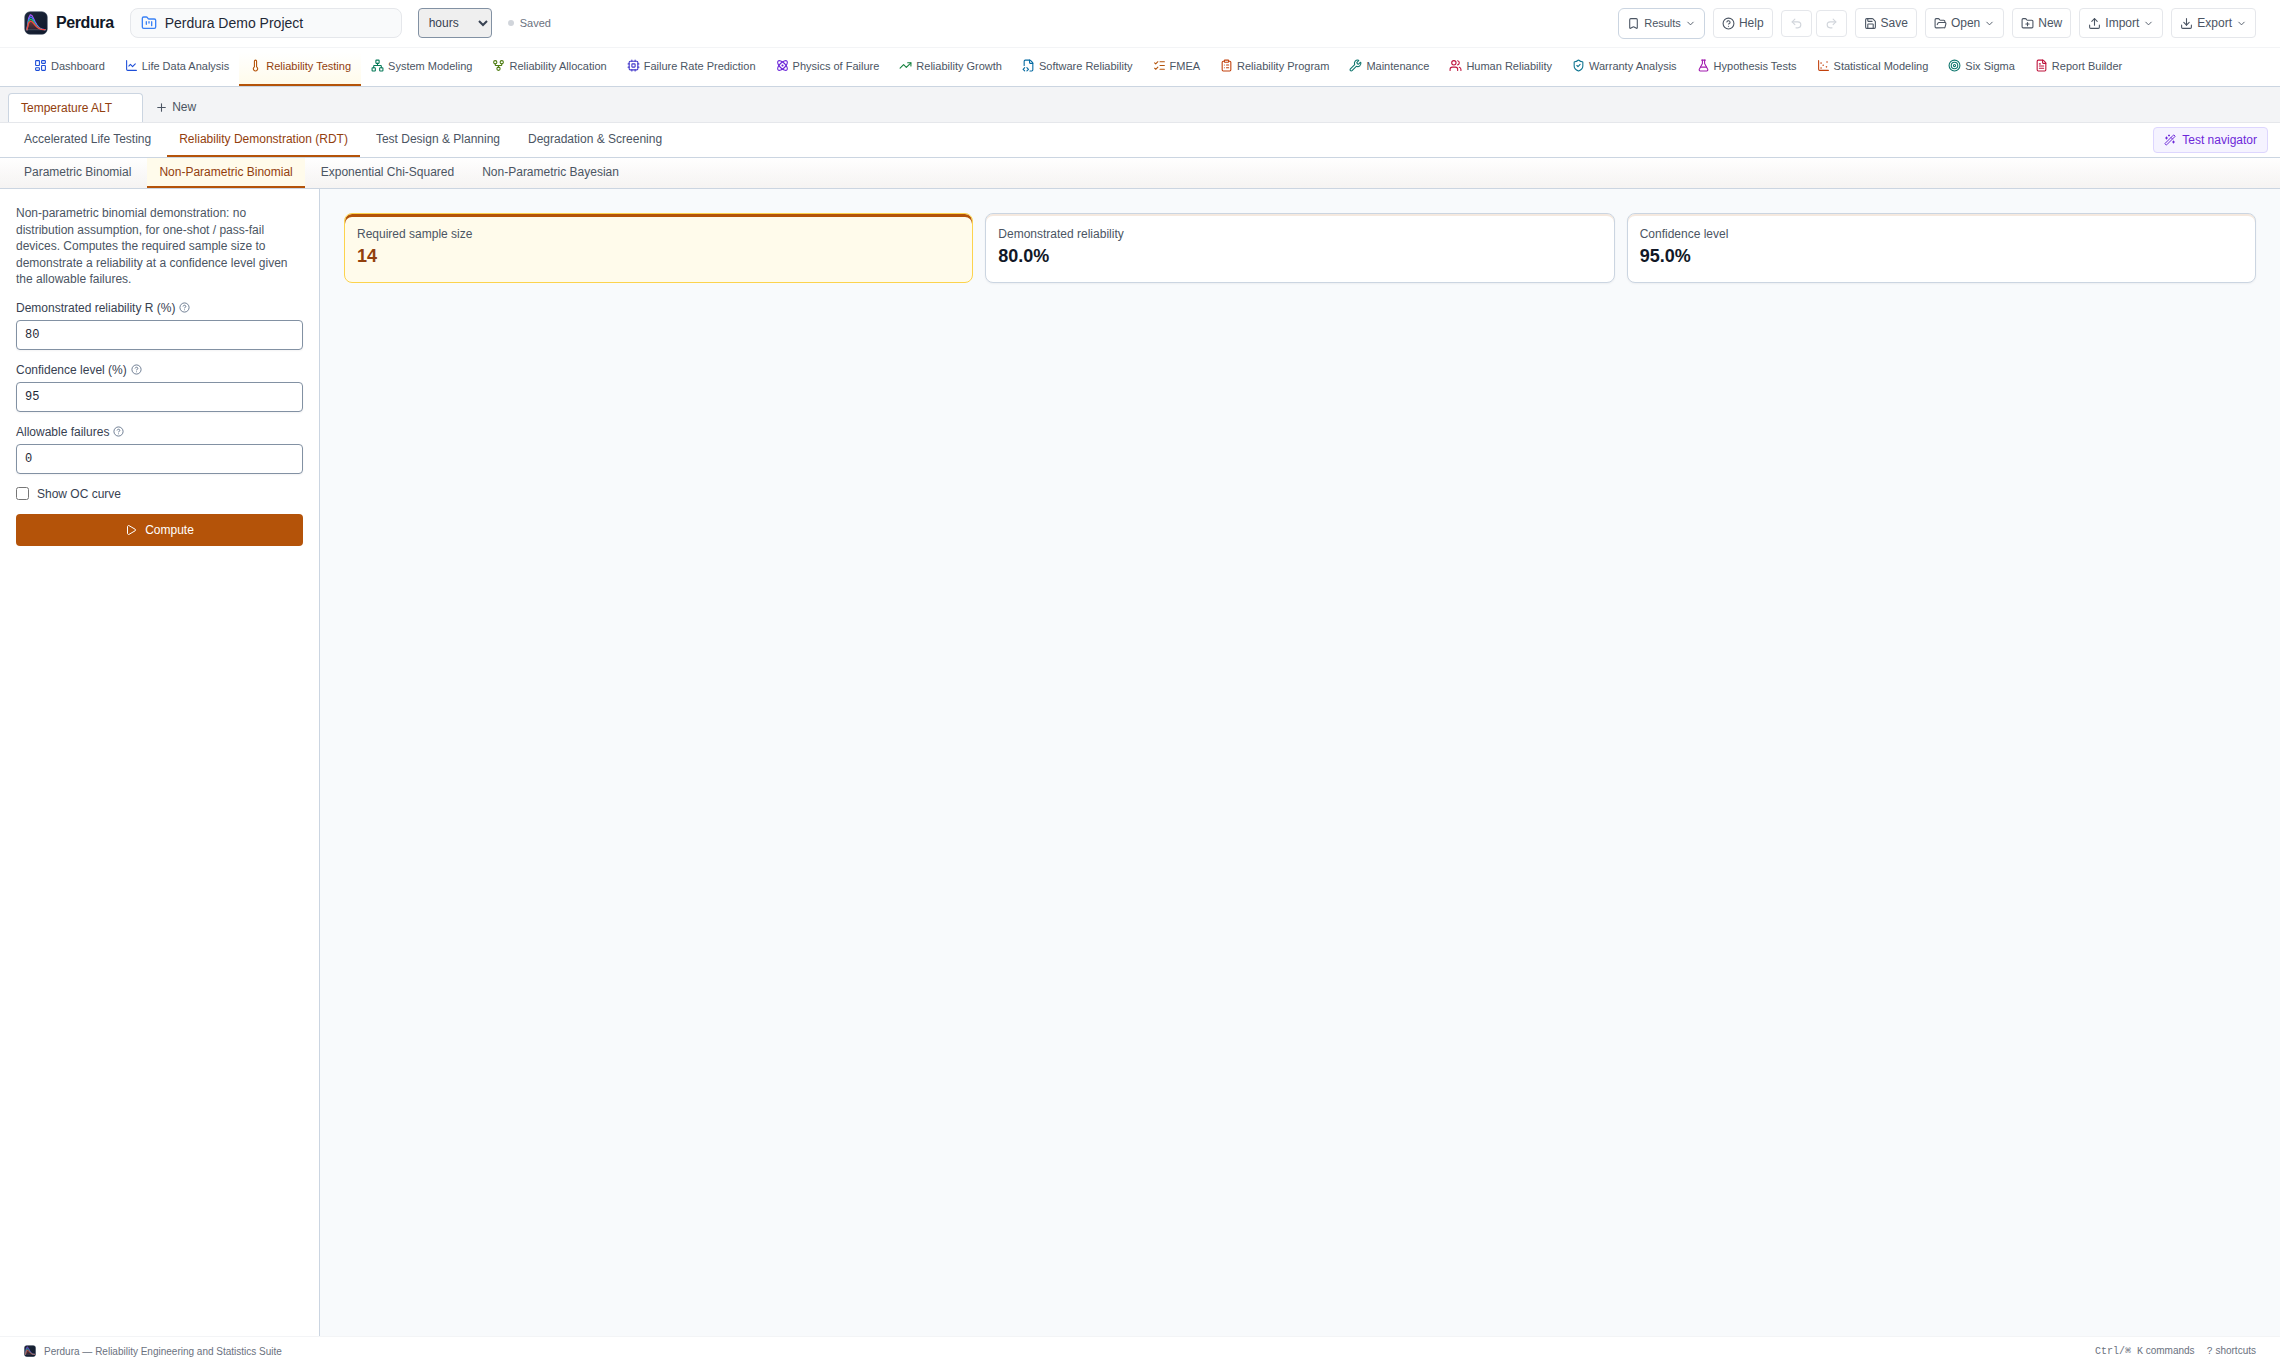
- Reliability demonstration testing with binomial sample size, parametric Weibull plans and operating-characteristic curves
- Non-parametric Bayesian planning, sequential sampling and simulation-based test strategies
- Difference-detection matrices for selecting sample size, test duration and confidence
- Probability plotting for supported life distributions with rank-adjusted censoring
- Stress–strength interference by numerical integration over selected distributions
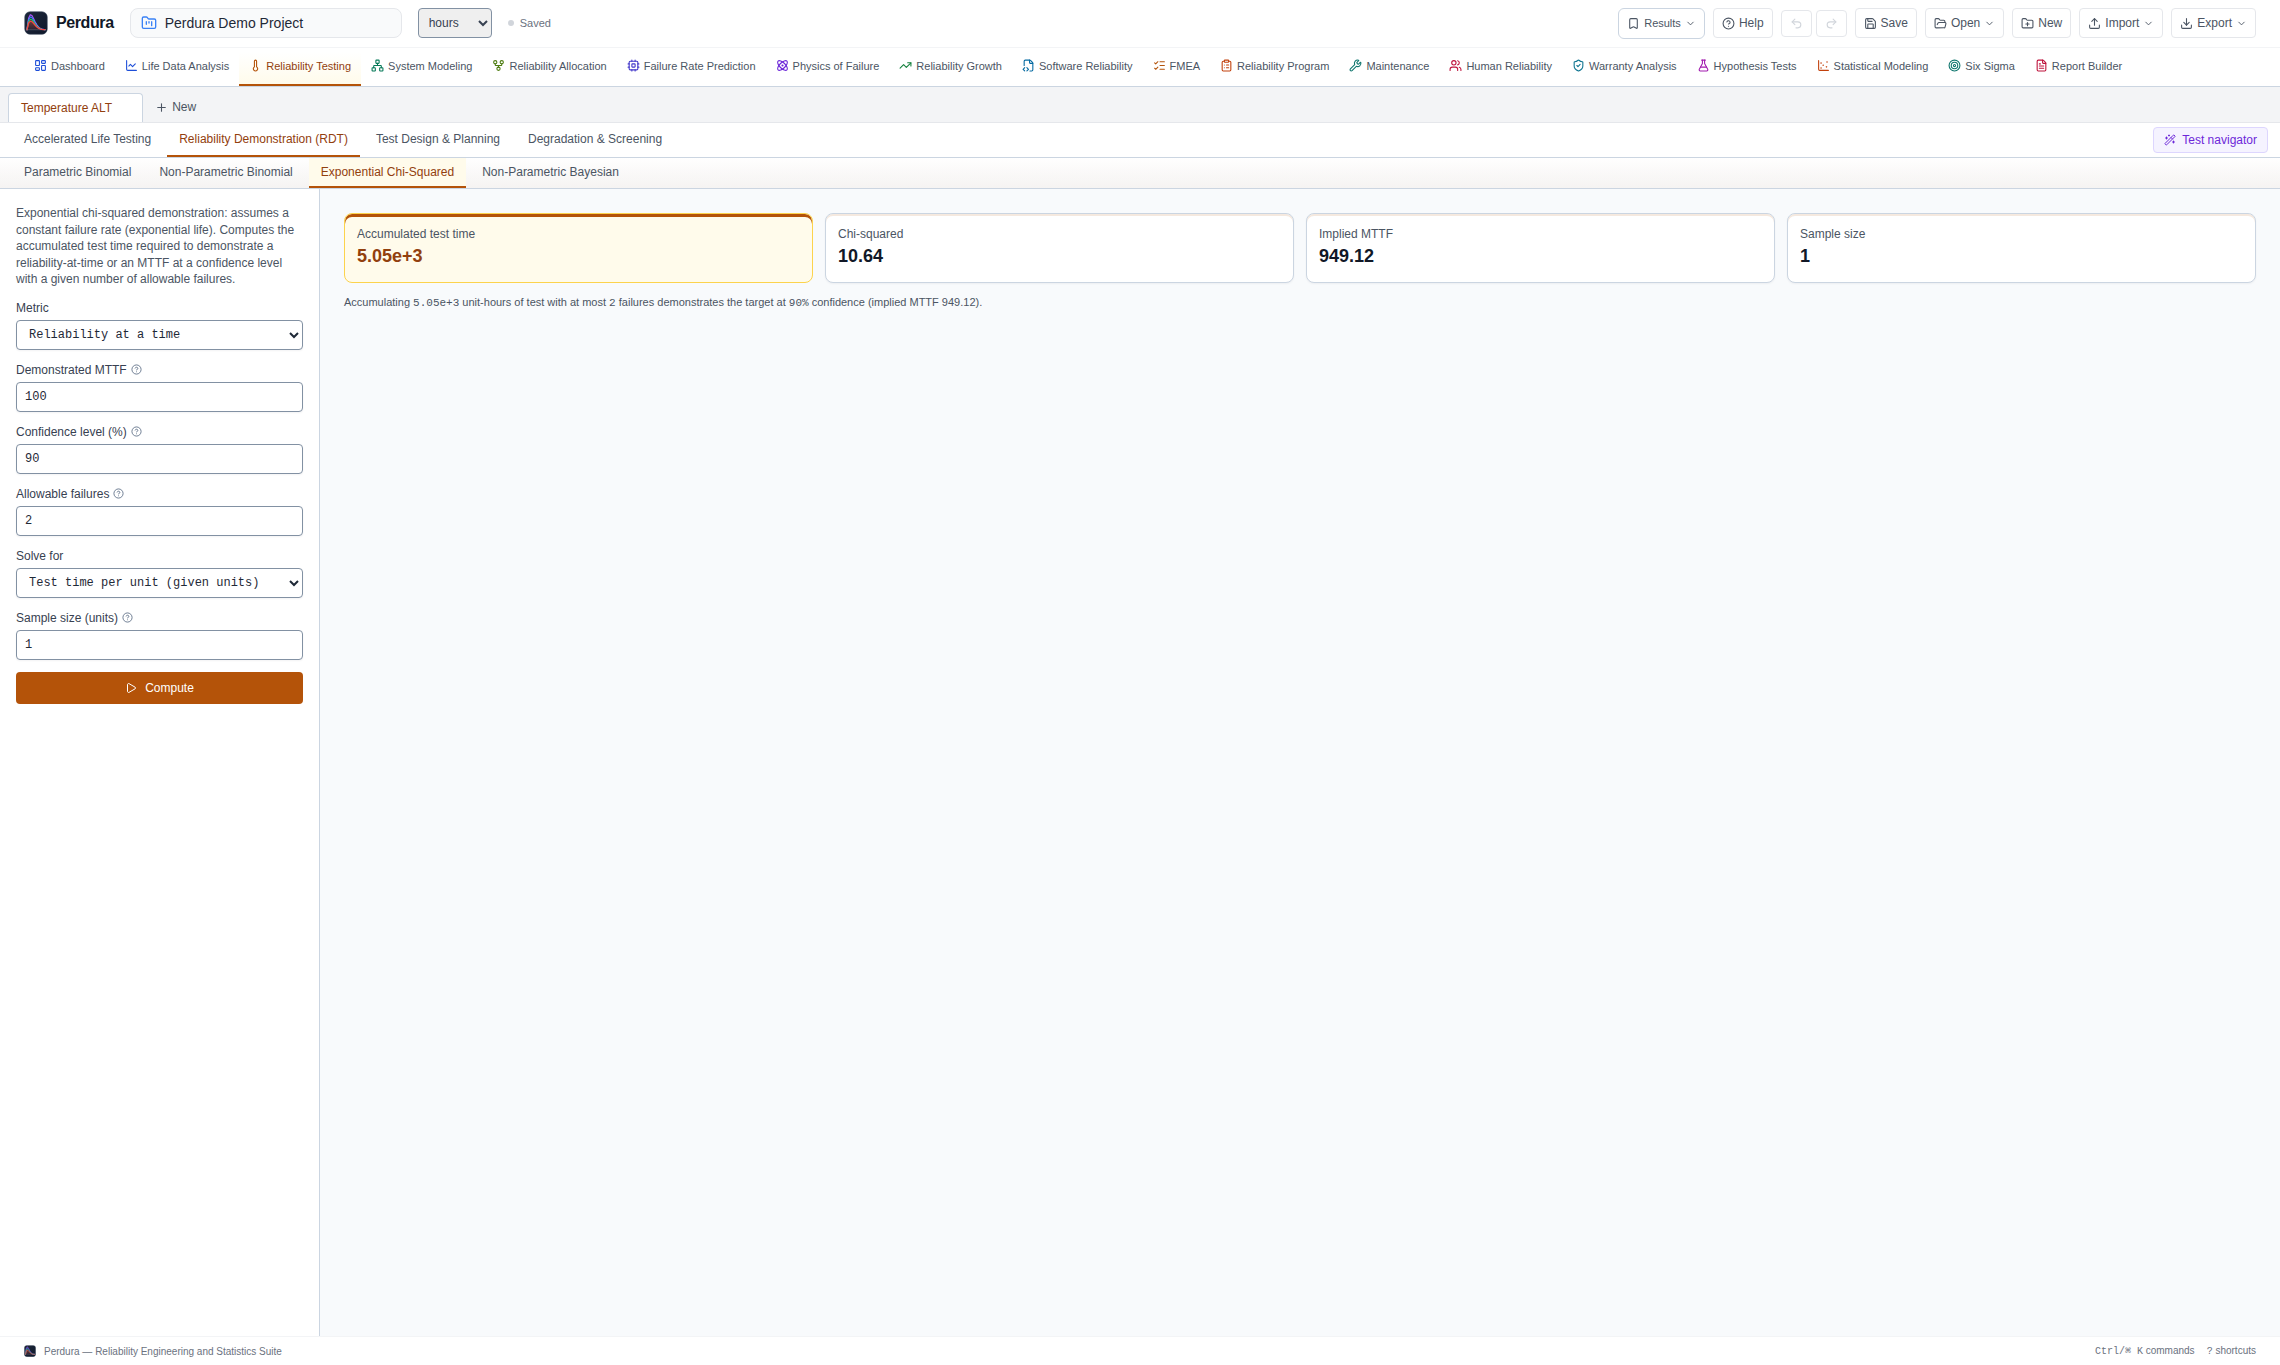
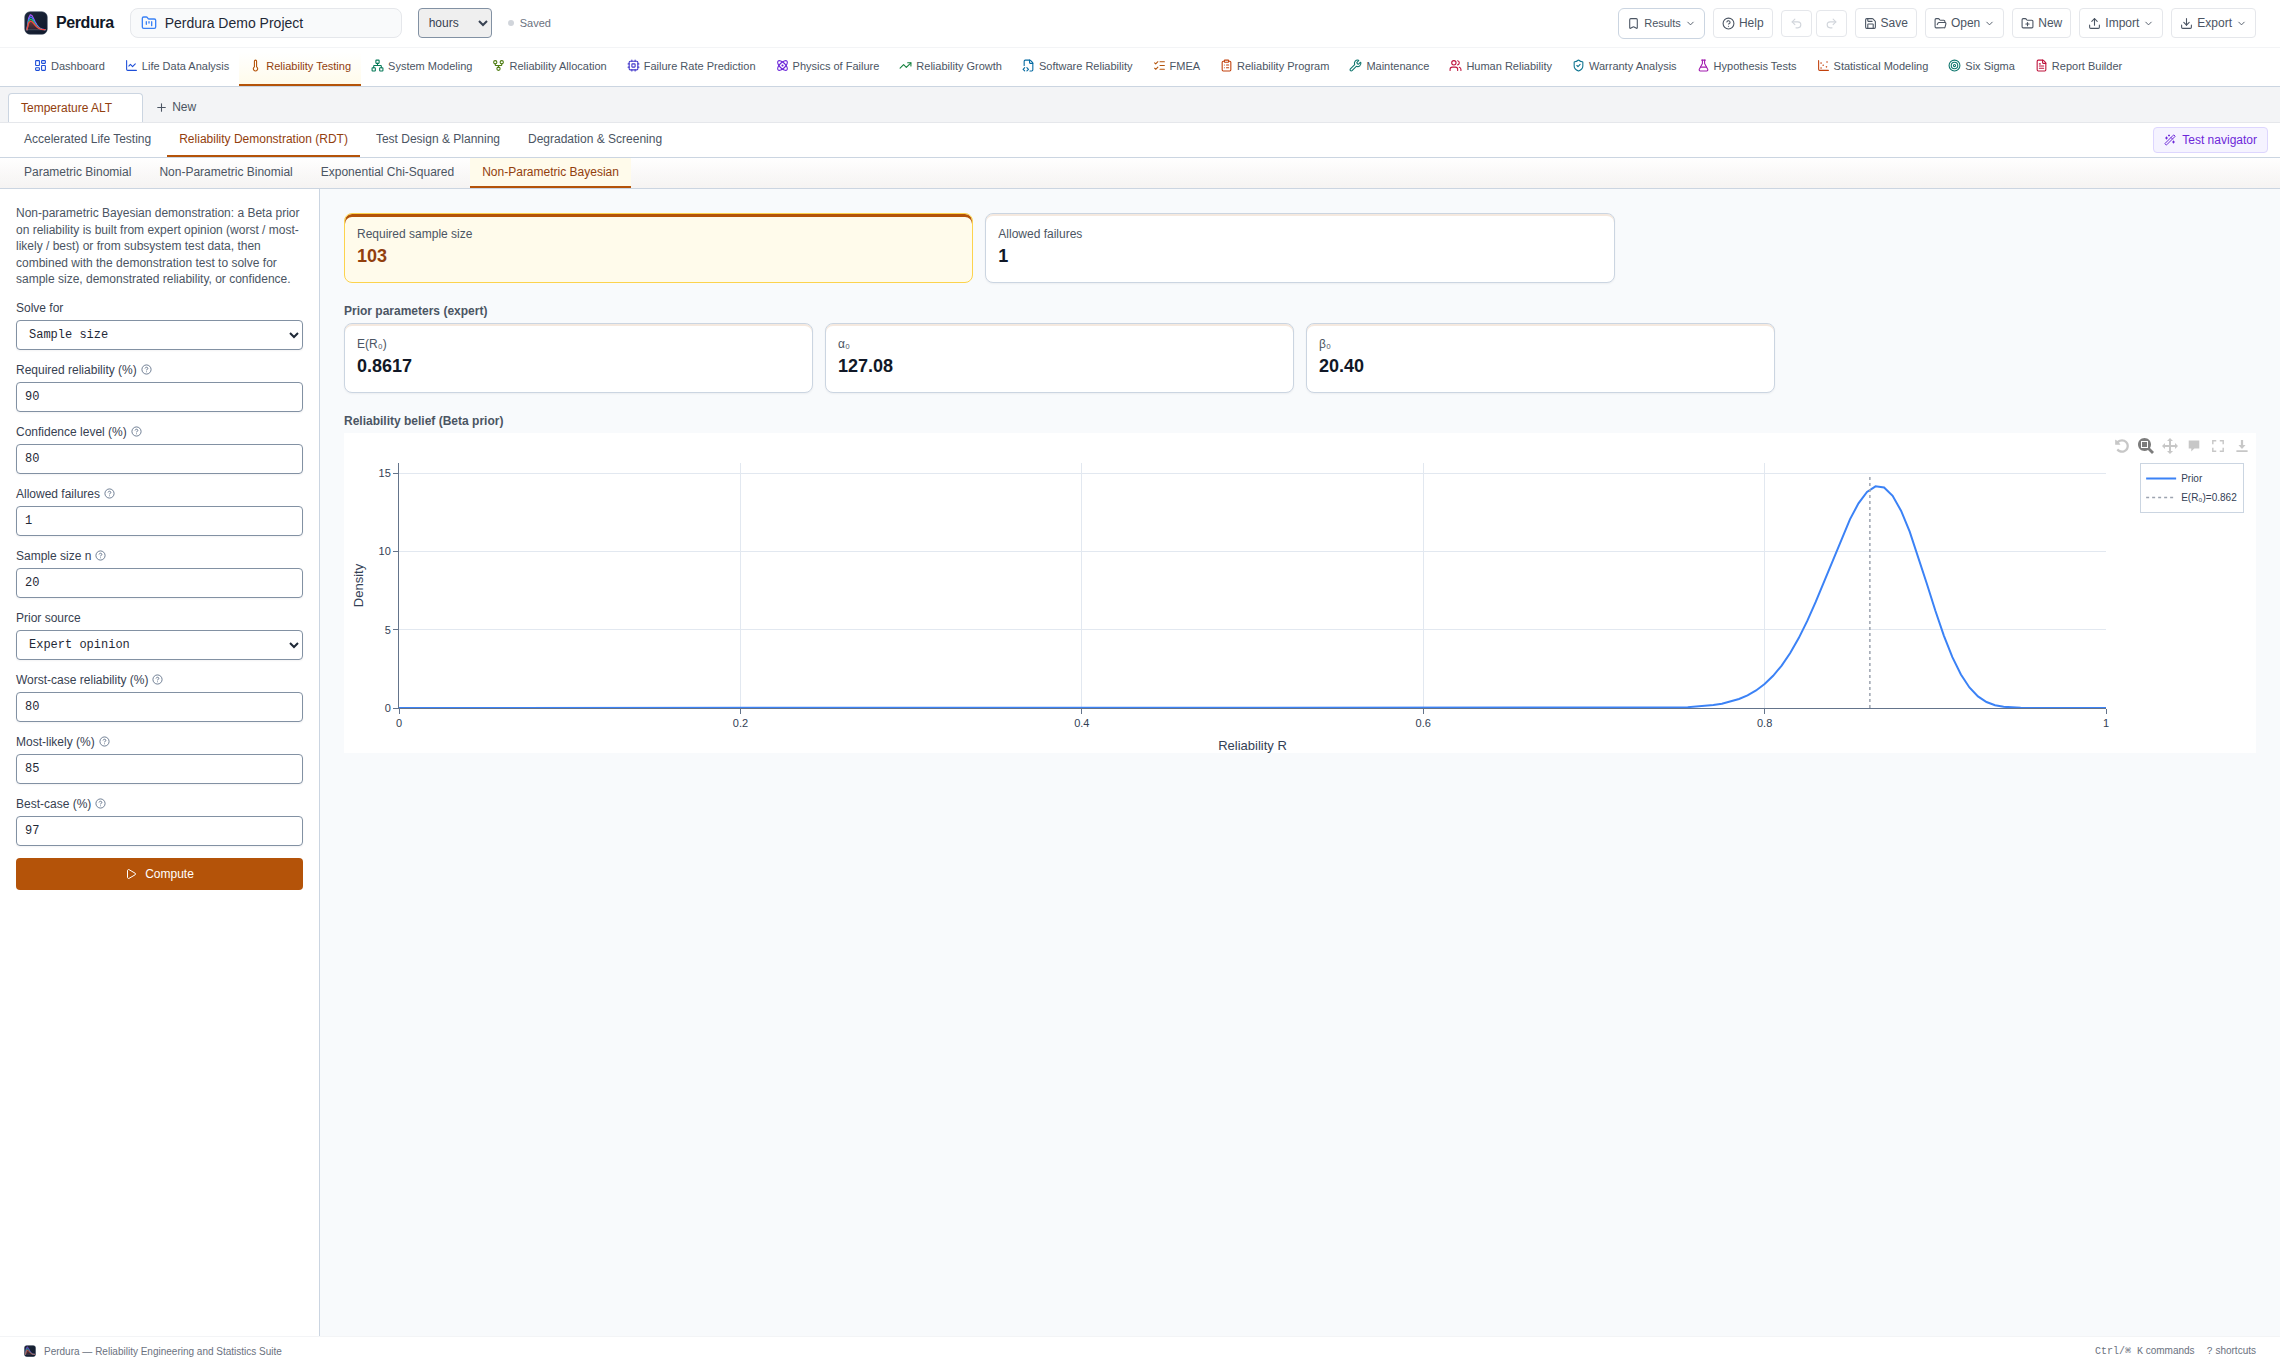
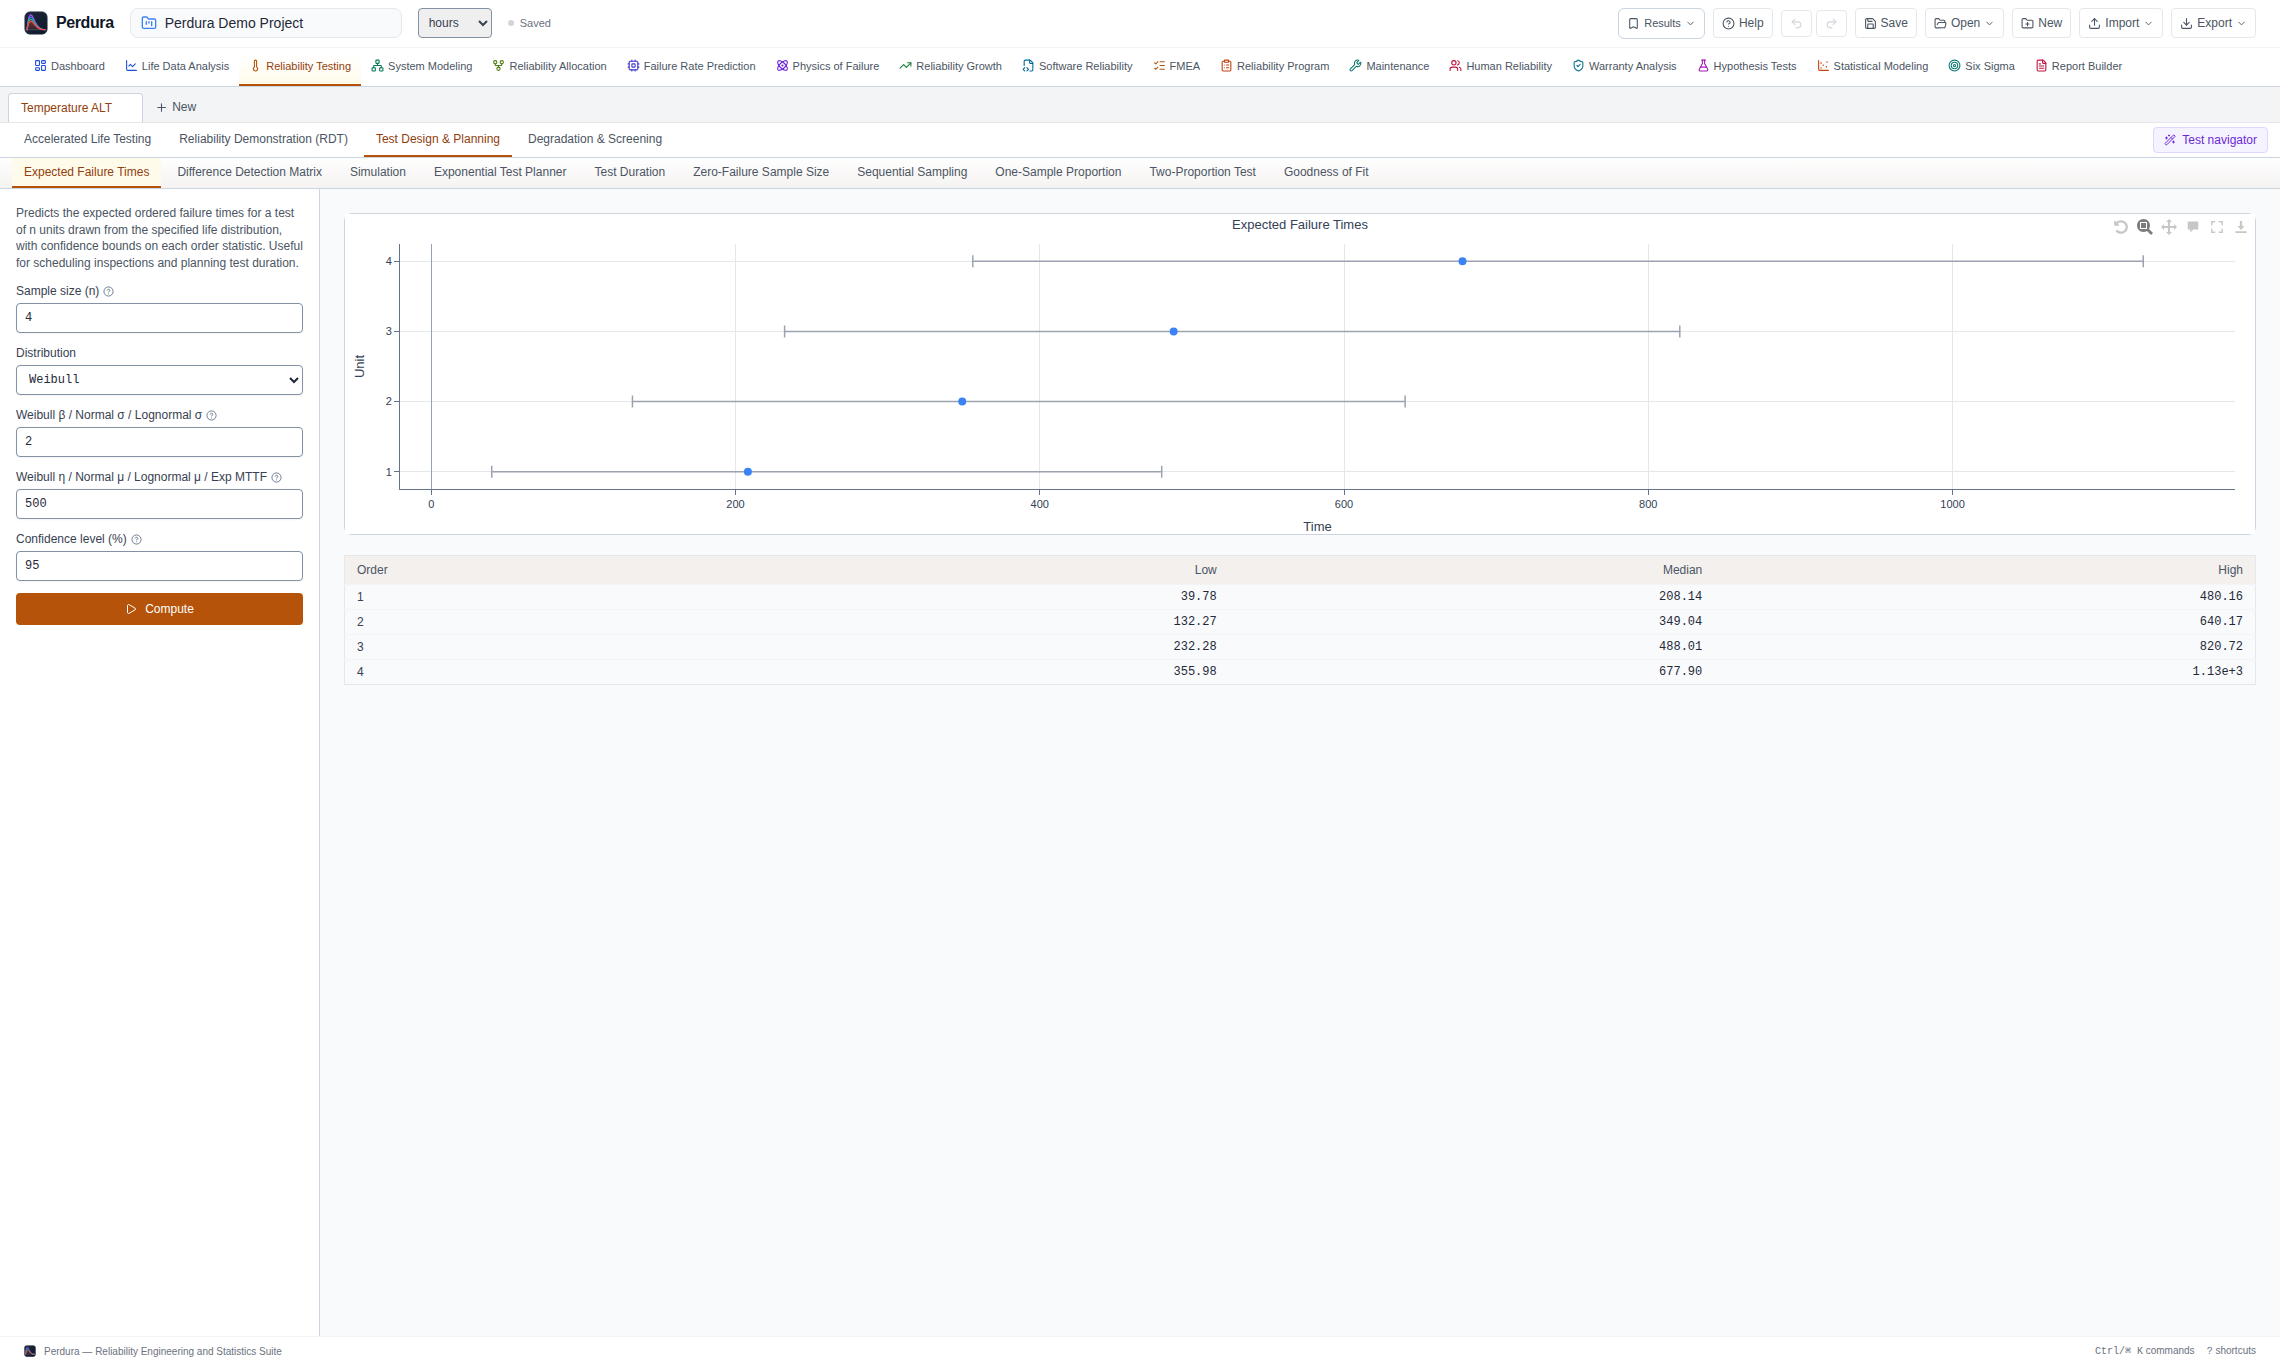
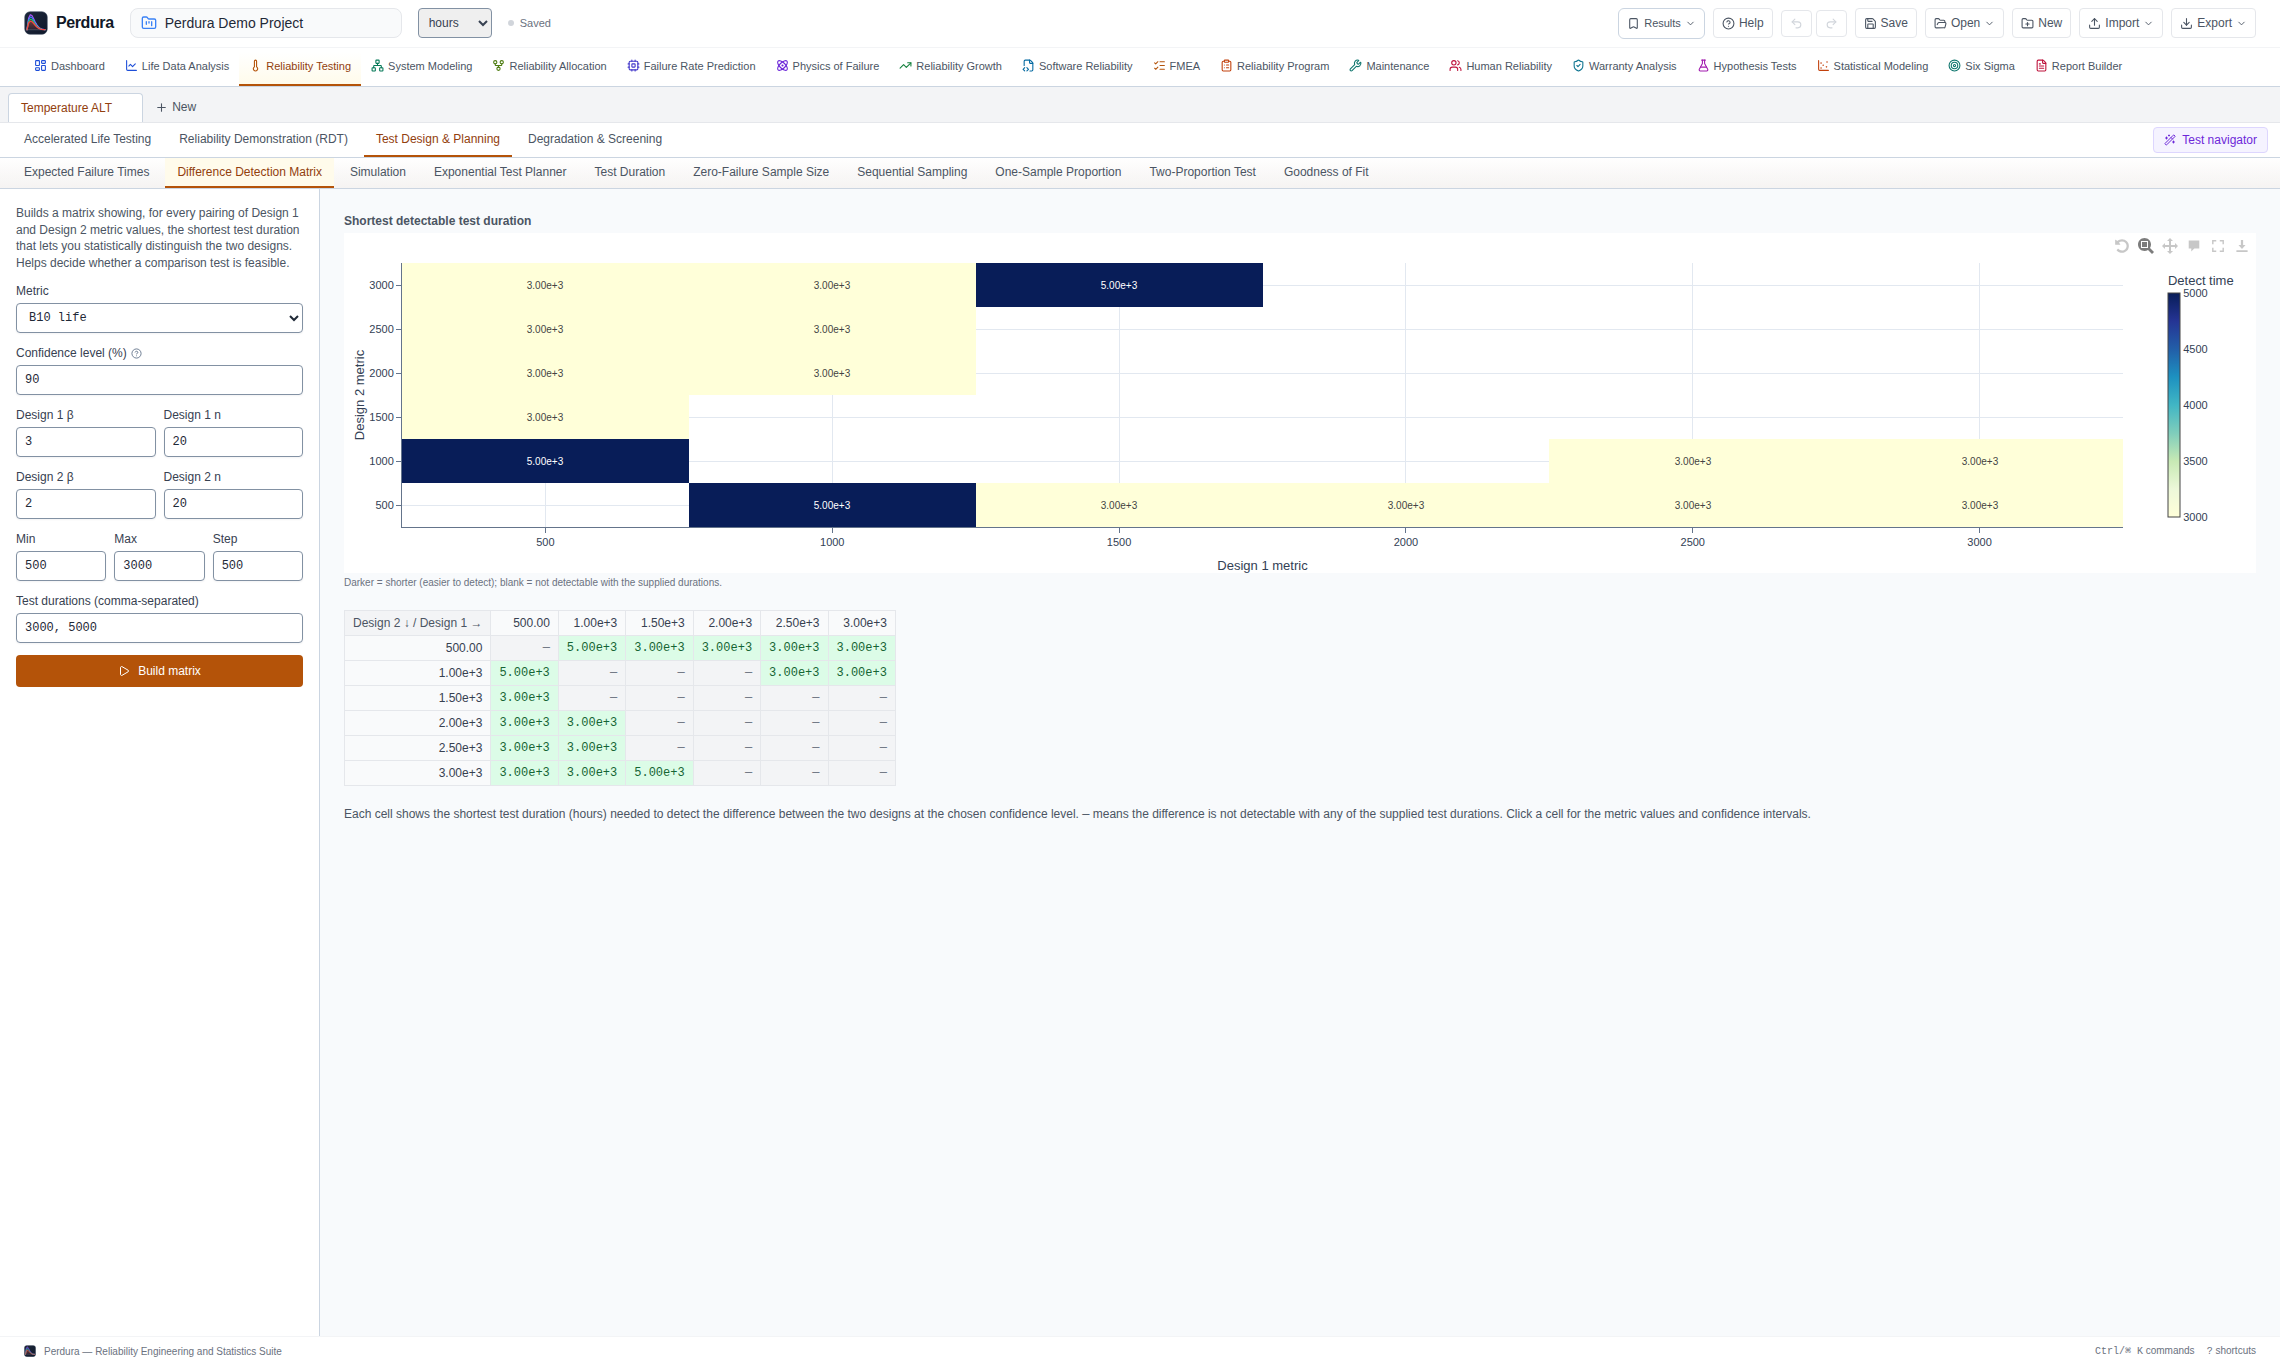

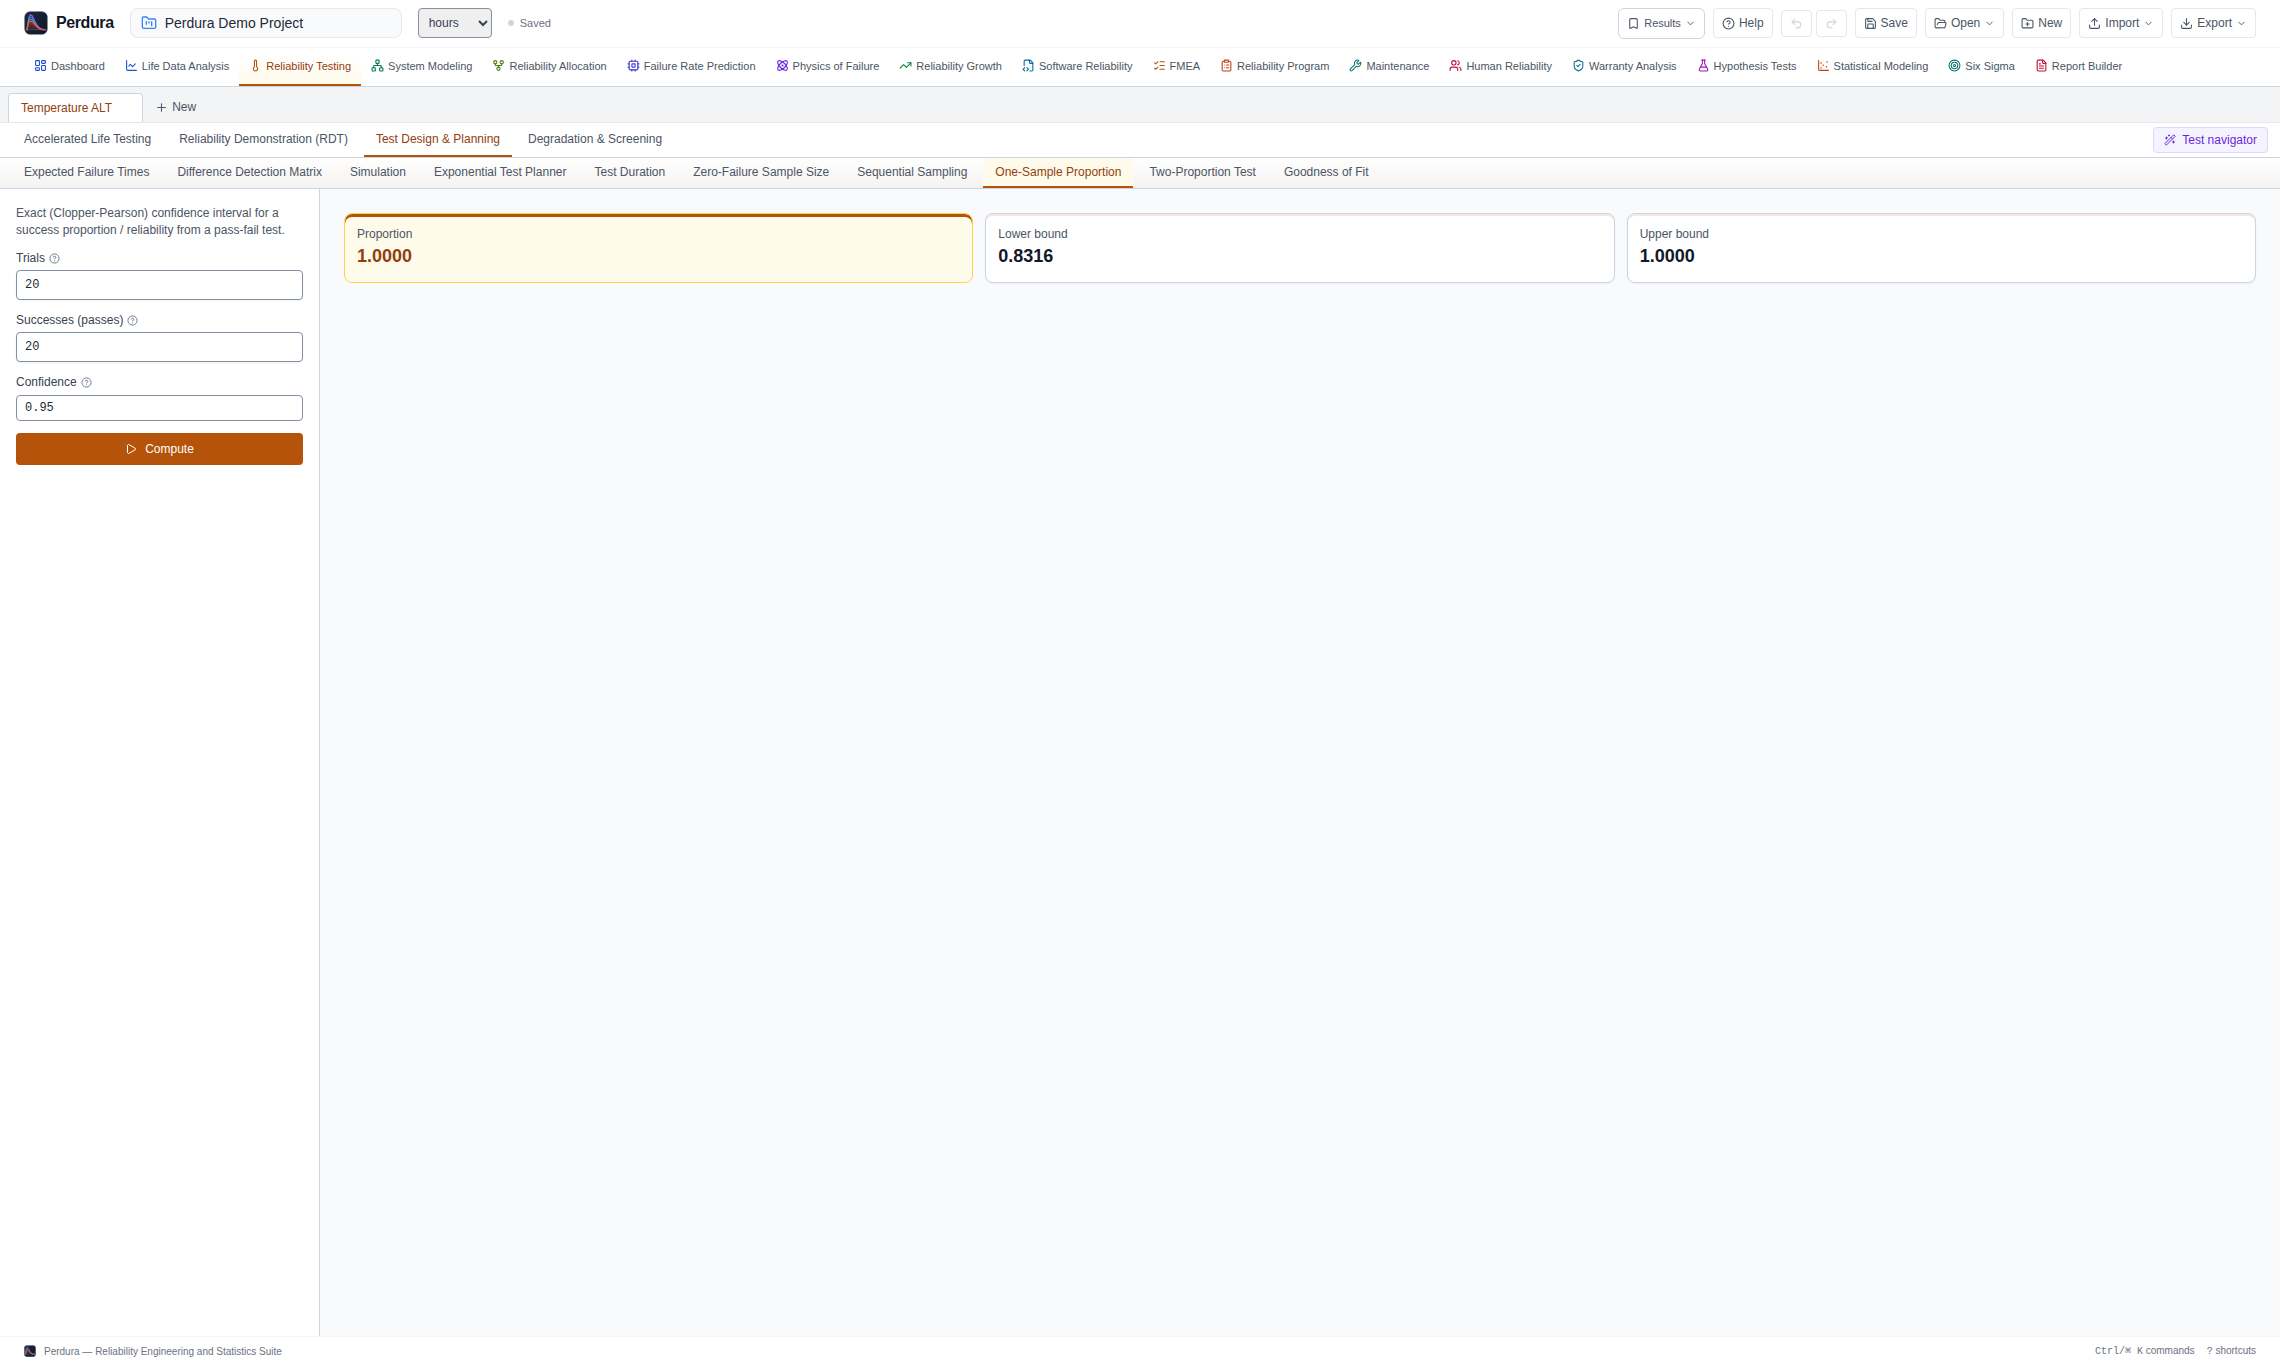
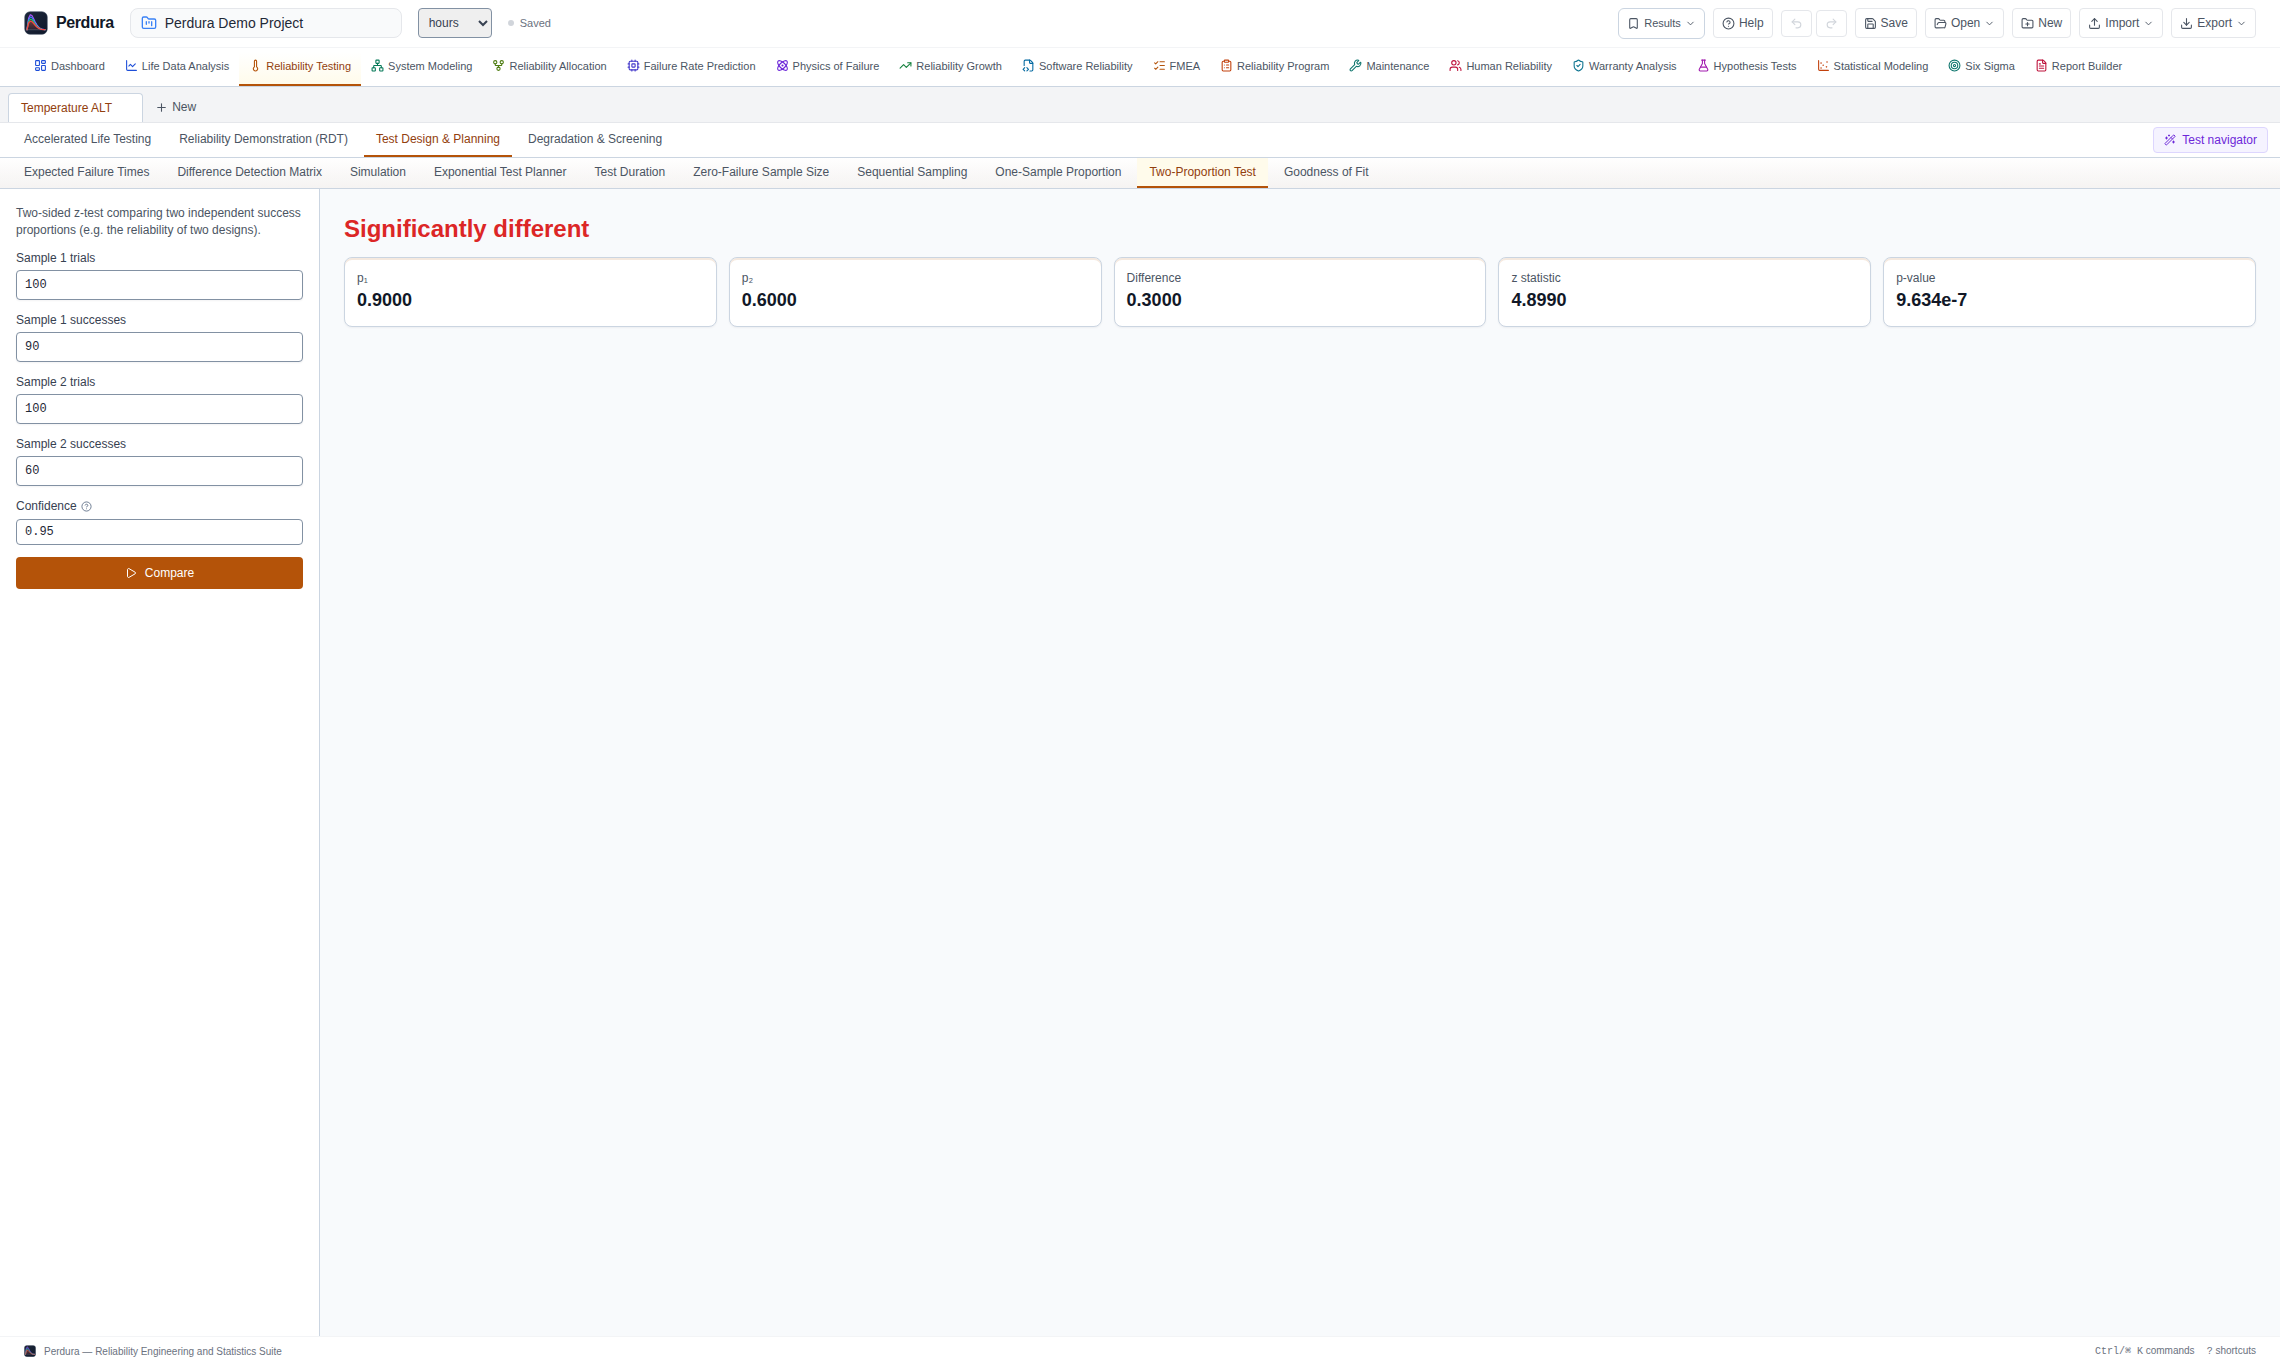
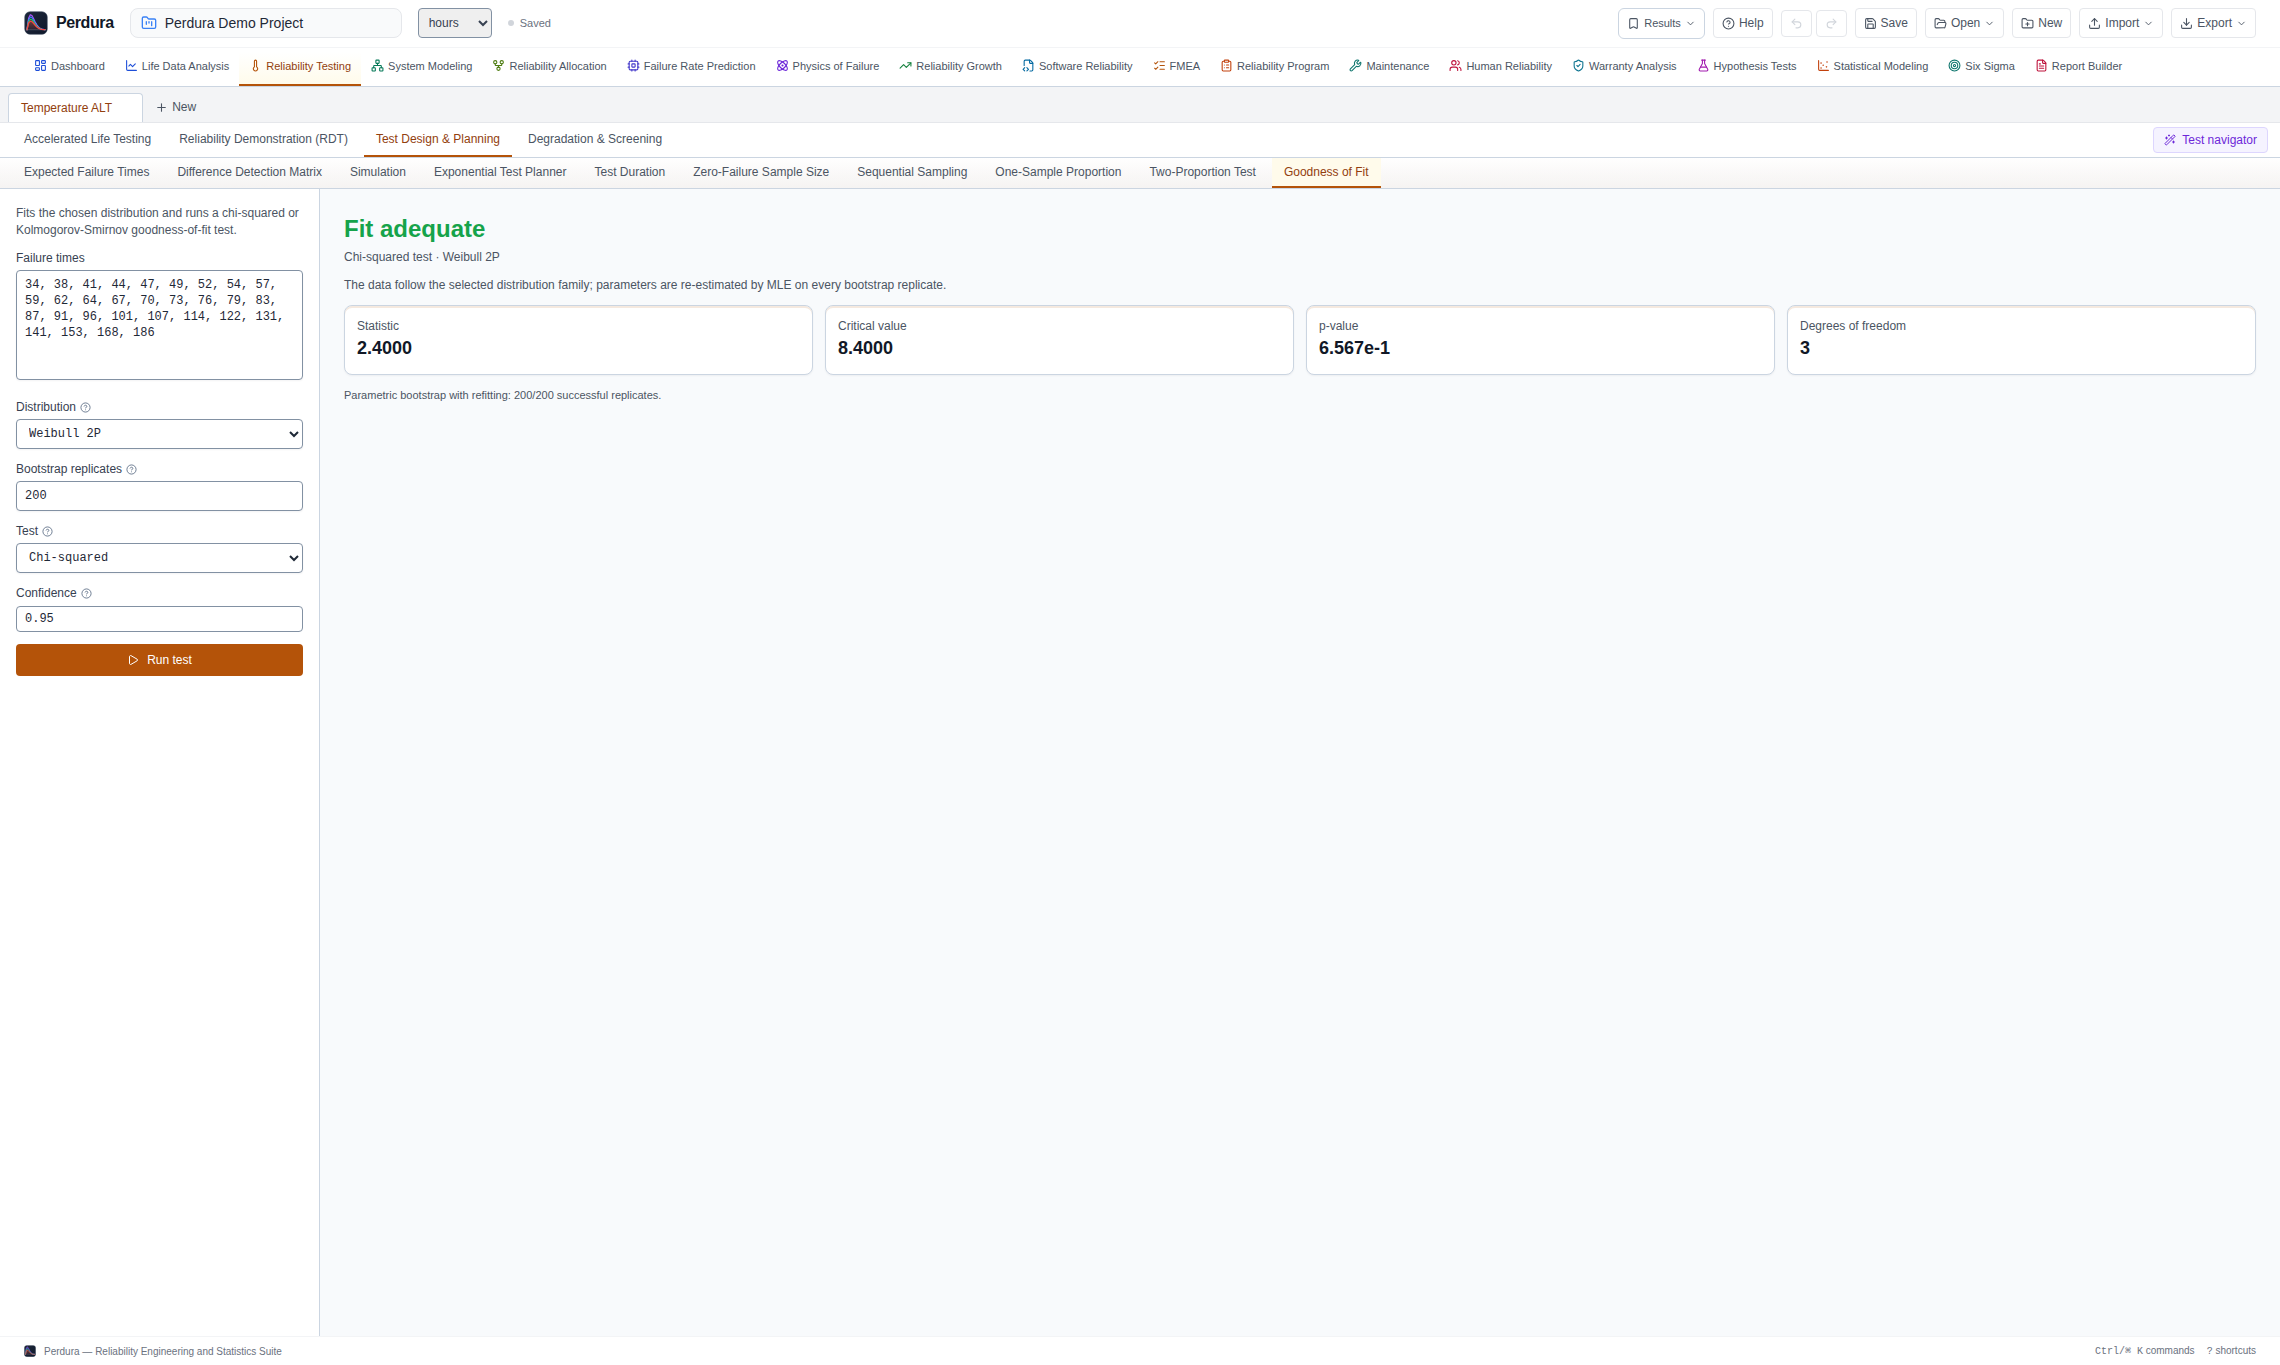
Use the arrows, arrow keys, or swipe to review each analysis. Open an image for full resolution.
Report Builder
Assemble analysis results, method context and engineering rationale into reviewable reports.
- Build paginated reports from generated plots, result tables, metrics and engineering narrative
- Reorder reusable blocks and retain report definitions in the Perdura project
- Export static PDF or interactive HTML while preserving source-analysis context
- Optionally bundle checksum integrity, software identity and analysis-provenance records with exported artifacts

Evaluate Perdura for your reliability workflow
Review the methods and assurance scope, then use a packaged release or inspect the implementation directly.